Table of Contents

Search

  1. Preface
  2. Understanding Domains
  3. Managing Your Account
  4. Using Informatica Administrator
  5. Using the Domain View
  6. Domain Management
  7. Nodes
  8. High Availability
  9. Connections
  10. Connection Properties
  11. Schedules
  12. Domain Object Export and Import
  13. License Management
  14. Monitoring
  15. Log Management
  16. Domain Reports
  17. Node Diagnostics
  18. Understanding Globalization
  19. Managing Distribution Packages
  20. Appendix A: Code Pages
  21. Appendix B: Custom Roles
  22. Appendix C: Informatica Platform Connectivity
  23. Appendix D: Configure the Web Browser

Administrator Guide

Administrator Guide

Resource Usage Indicators

Resource Usage Indicators

The resource usage indicators are bar charts and graphs that compare resource usage for a domain process to resource usage of all processes on the machine. Select a domain process to compare with all processes. You can view current usage statistics or statistics for the previous 60 minutes.
You can view usage statistics for memory and CPU. Choose whether to view current statistics or to view graphs of usage for the past 60 minutes. Click the selection arrow and choose
Current
or
Last Hour Trend
.
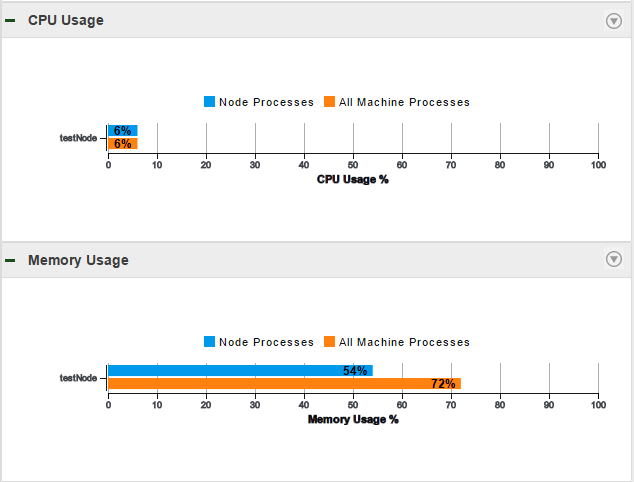
The following image shows the current resource usage in a domain that contains one node:
Two bar charts that compare resource usage for processes that are running on the node to resource usage for all processes running on the machine. The charts show the usage as a percentage out of 100. The node processes are represented by blue lines and the machine processes are represented by orange lines.
The information that the graphs display varies based on which domain object you select.
The following table describes the information that you can view when you select the domain or a domain object:
Domain Object
Usage Indicator Content
Domain
The usage indicators display the following content:
  • Nodes in the domain.
  • Resource usage of all processes running on each node in the domain.
  • Resource usage of all processes running on the machine.
Node
The usage indicators display the following content:
  • The node.
  • Resource usage of processes running on the node.
  • Resource usage of all processes running on the machine.
Service
The usage indicators display the following content:
  • The node on which the service process runs.
  • Resource usage of the service process that is running on the node.
  • Resource usage of all processes running on the machine.
Service in high availability mode
The usage indicators display the following content:
  • The node on which the service process is running.
  • Resource usage of the service process that is running on the node.
  • Resource usage of all processes running on the machine.
Service running on a grid
The usage indicators display the following content:
  • All nodes on which the service process runs.
  • Resource usage of the service process that is running on each node.
  • Resource usage of all processes running on the machine.
Grid
The usage indicators display the following content:
  • All available nodes in the grid.
  • Resource usage of all processes running on each node in the domain.
  • Resource usage of all processes running on the machine.
If a
See More…
link appears in the indicator, you can click it to view the complete list of nodes in the domain. You can sort the list by node name, process usage on the nodes, or process usage on the machine. You can also search the list for a particular node.

0 COMMENTS

We’d like to hear from you!