You only see this command if you have selected an agent.
Use the
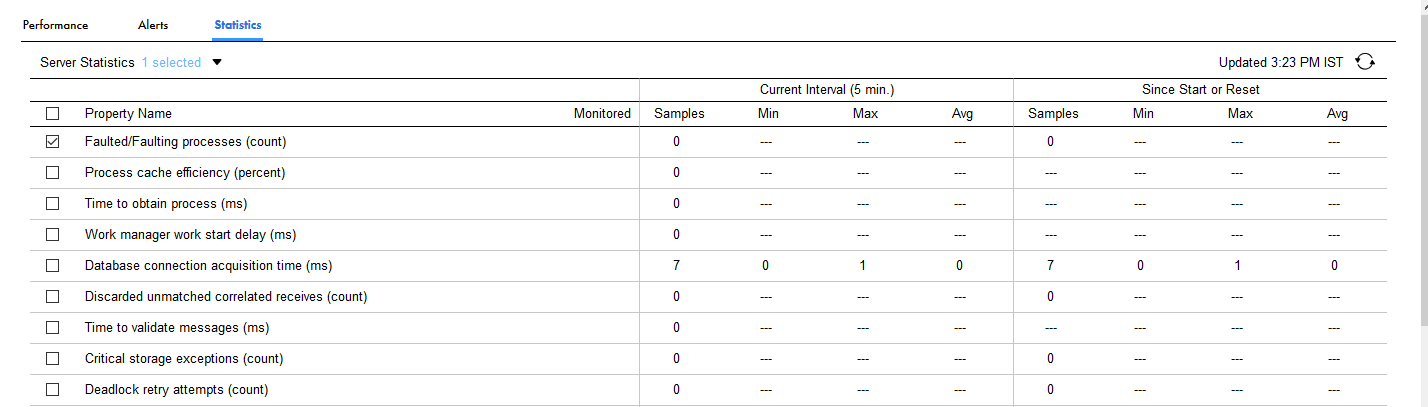
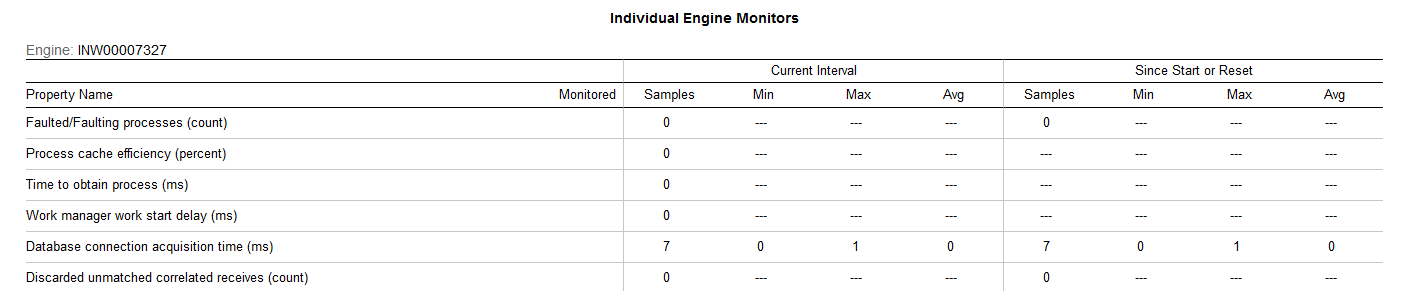
Statistics page to view the monitoring properties you configured or which are the default. Process Server collects engine statistics and then aggregates them by intervals. If desired, you can configure a threshold interval and an error/warning level for each of these properties. If you configure these settings, you will see additional signals displayed on this page, such as an eyeglass icon indicating a property is being watched.
During a collection interval, Process Server maintains statistics for each configured property value, including the maximum, average, and total count values. In addition, historical statistics are collected. Historical statistics include minimum and maximum values for the intervals being recorded. Statistics are collected in-memory.
Select
Reset
to clear statistics. For example, if you correct an error condition, you can reset the statistics collection starting with zero values to see if performance improves. Once all errors and warnings are cleared, the engine monitoring level is reset to Normal.