service, you can monitor all ingestion jobs that were deployed from the
Mass Ingestion
service
, including
application ingestion
jobs,
database ingestion
jobs,
file ingestion
jobs, and
streaming ingestion
jobs
.
The
Mass Ingestion
page has the following tabs:
The
Overview
tab displays buttons that you can use to filter the list of ingestion jobs by job type and state.
The
All Jobs
tab lists all types of ingestion jobs that any member in your organization created and deployed. It includes the same column properties as on the
My Jobs
page in the
Mass Ingestion
service.
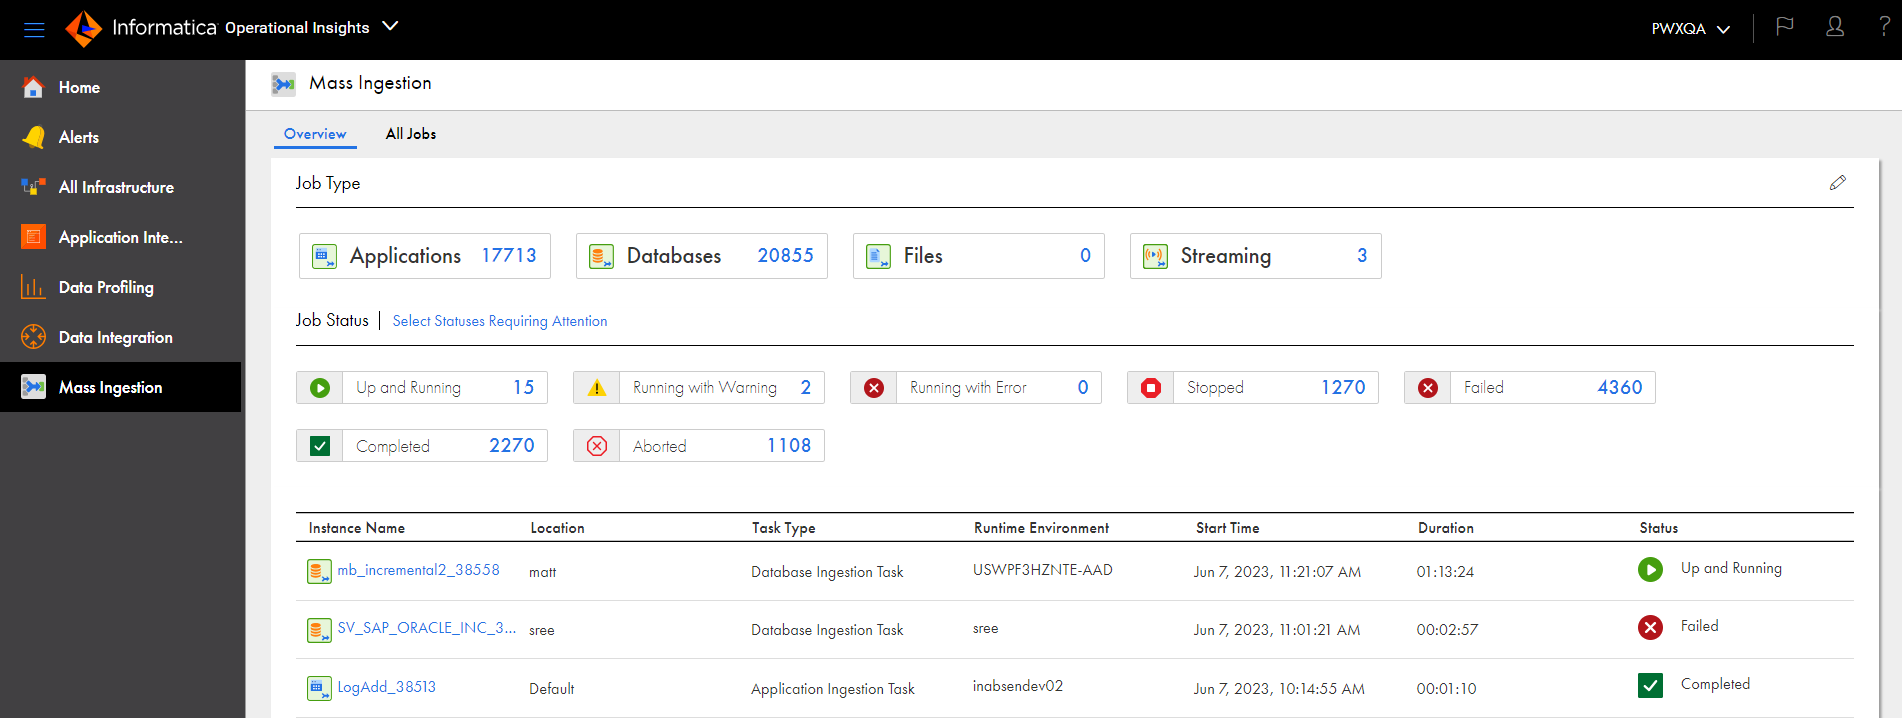
Overview tab
The
Overview
tab Initially lists all types of ingestion jobs with all statuses. Each button shows the number of jobs with that job type or status. For example:
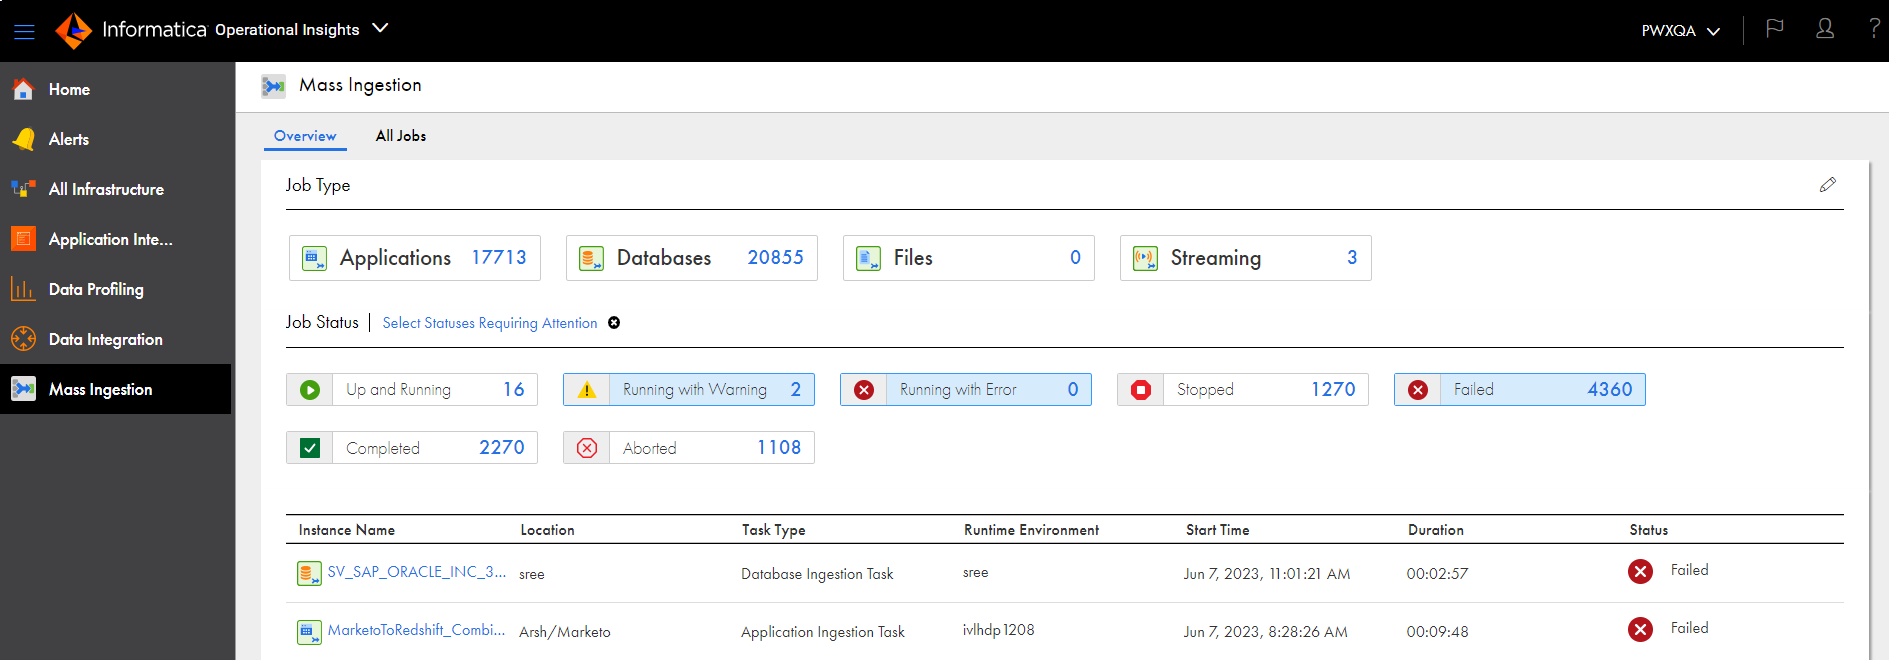
You can use the buttons at the top to filter the jobs by job type and status or click
Select Statuses Requiring Attention
to show only the jobs that have a status of concern. The following example shows the
Overview
tab for all jobs with statuses requiring attention:
To control the status buttons that appear on the
Overview
tab, click the
Edit
(pencil) icon. Then in the
Reorder Job Status
dialog box, select the
Visibility
check box next to each job status for which you want to display buttons and jobs.
To rearrange the order of the job status buttons, click the
Edit
(pencil) icon. Then in the
Reorder Job Status
dialog box, select and drag a job status row up or down.
To filter the list of jobs on the
Overview
tab, use in any of the following methods:
To see only
application ingestion
jobs,
database ingestion
jobs,
file ingestion
jobs, or
streaming ingestion
jobs, click the button for a job type. The selected button is highlighted in blue. To see all types of ingestion jobs again, click the selected button again. If you selected status filters for a job type, those filters are also cleared when you deselect the job type.
To see the jobs that match a particular job status, click a status button. If you want to see jobs of a particular job type and status, first select the job type and then select the status. You cannot select multiple status buttons at the same time on the
Overview
tab. To clear the filter, click the selected status button again.
To see all jobs with a status that might require your attention, click
Select Statuses Requiring Attention
above the job status buttons. This option lists the
application ingestion
jobs or
database ingestion
jobs with the
Failed
or
Running with Warning
status,
file ingestion
jobs with the
Failed
status, or
streaming ingestion
jobs with the
Running with Error
or
Running with Warning
status. To clear the filter, click
Select Statuses Requiring Attention
again. If you want to see jobs that require attention for a specific job type, first select the job type and then click
Select Statuses Requiring Attention
.
All filters that you set on the
Overview
tab or in the
Reorder Job Status
dialog box are active only for the current session or until you change them during the session.
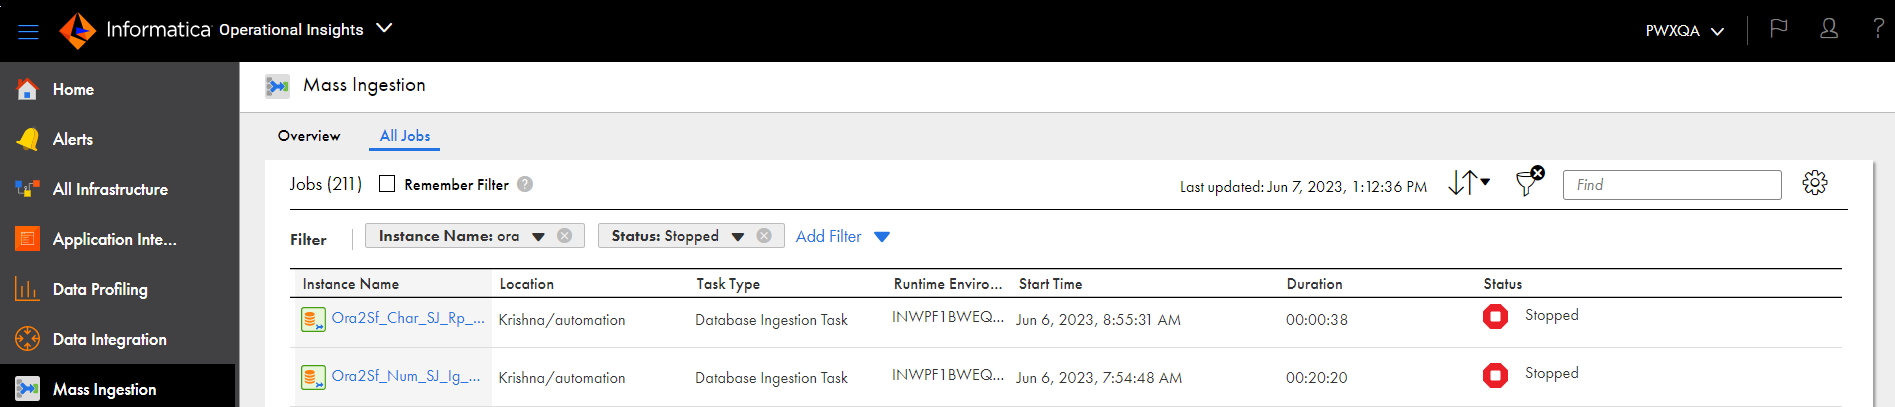
All Jobs tab
The
All Jobs
tab lists all ingestion jobs with optional filtering by job instance name, task type, runtime environment, and status. You can also perform some actions on a job from this tab, such as Stop, Undeploy, Redeploy, Run, or Resume, depending on the job status.
For example, the following image shows the
All Jobs
tab filtered to show job instances that have names including "ora" and the status of Stopped:
If the list of jobs is long, use any of the following methods to make finding the job easier:
To
sort
the listed jobs, click a column heading or click the Sort up/down arrows icon and select a field to sort by. The default sort order for
application ingestion
jobs,
database ingestion
jobs, and
streaming ingestion
jobs is the time of task deployment, from latest to earliest. The default sort order for
file ingestion
jobs is the job start time, from latest to earliest.
To
find
a job based on the job name, enter the job instance name, or any part of the name, in the
Find
text box. With a partial name, the Find operation looks for that particular string anywhere in the instance name. In
Operational Insights
, you can include the percent sign (%) wildcard within an instance name search string to represent one or more characters, such as "ing2%798". Do not include the following symbols: question mark (?), number sign (#), or ampersand (&). If you include any of these symbols, the Find operation returns no results.
To
filter
the list of jobs, click the Filter icon. Then click
Add Filter
and enter filter criteria for one or more fields. For the
Instance Name
field, you can enter the full job instance name or part of the name. In
Operational Insights
, you can include the percent sign (%) wildcard in the instance name value to represent one or more characters within the name, for example, "vp%test3". Your filter is saved for your user name only, for the current session until you change it. In
Operational Insights
, you can save the filter for the subsequent sessions by selecting the
Remember Filter
check box. To clear existing filter criteria, click the Filter icon again.
To change the line spacing in the list, click the
Settings
icon to the right of the
Find
box.
You can perform some actions on a job, depending on the job status and task type. From the actions (...) menu at the right end of each job row, select an action type.