The Usage area and its buttons are only available for guides. Also, only users with admin permissions can view this report.
Selecting the
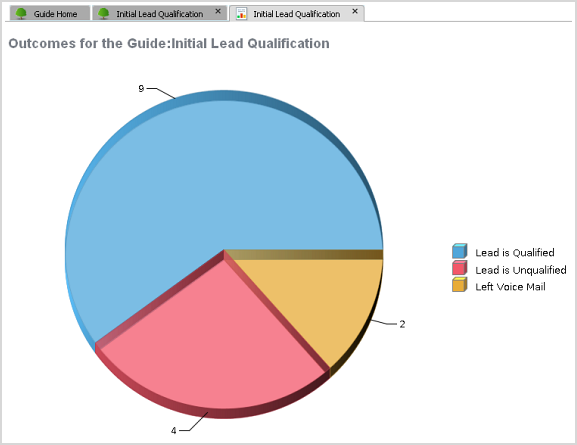
Outcomes
button tells Screenflow to display a pie chart showing the different outcomes that occurred.
Note
: An "outcome" is a value (always text) that indicates the result of executing a guide to its final step. These outcomes were set in the guide properties.
The number of outcomes shown in the chart is the total for all interactions, not just today's.
Note
: If logging was turned off for a guide, information is either limited or will not exist. This is set using the