Data Integration Hub
- Data Integration Hub 10.4.1
- All Products


Element
| Description
|
|---|---|
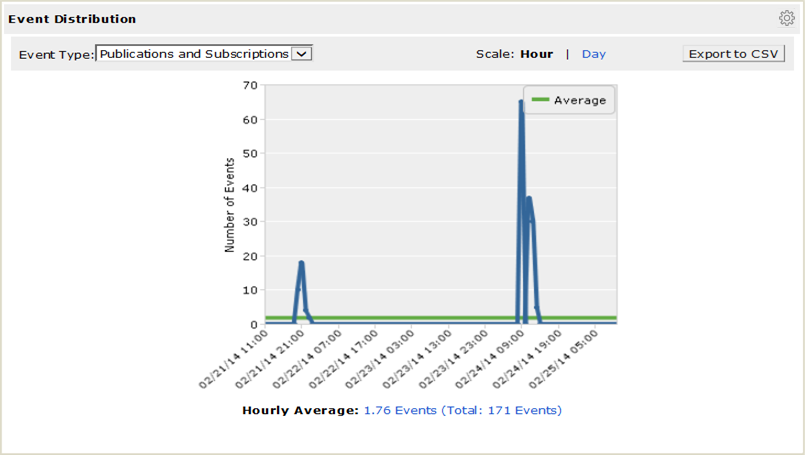
Event Type
| Type of events to display. You can choose one of the following options:
|
Event Status
| This applies only to the Dashboard using the metadata directory. Type of event status to display. You can choose one of the following options:
Select
All to view the Event Distribution report.
|
Scale
| Granularity of the calculations. You can choose one of the following options:
If you select a time frame filter longer than seven days, you can only view event distribution on a day scale.
|
Number of Events
| Number of events that
Data Integration Hub generated during the selected time frame.
Appears on the Y-axis of the panel.
|
Time Distribution
| Date or time intervals during which
Data Integration Hub generated events.
Appears on the X-axis of the panel.
|
Average Line
| Average, over the selected time frame, of the average number of final events that
Data Integration Hub generated each day or each hour and the total number of events for the selected time frame.
|
Daily/Hourly Average
| Total count of final events within the entire selected time frame. You can click the link to display the events in the
Event List page.
|
Export as CSV
| Saves the data in the report as a CSV file.
|

Element
| Description
|
|---|---|
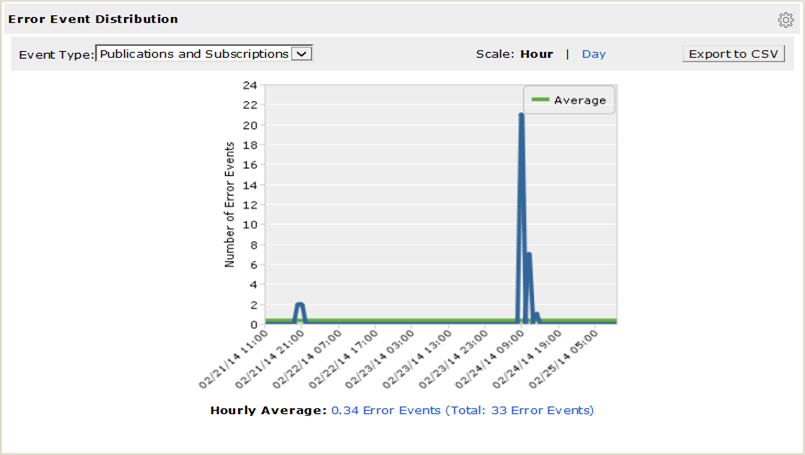
Event Type
| Type of events to display. You can choose one of the following options:
|
Event Status
| This applies only to the Dashboard using the metadata directory. Type of event status to display. You can choose one of the following options:
Select
Error Event to view the Error Event Distribution report.
|
Scale
| Granularity of the calculations. You can choose one of the following options:
If you select a time frame filter longer than seven days, you can only view error event distribution on a day scale.
|
Number of Error Events
| Number of error events that
Data Integration Hub generated during the selected time frame.
Appears on the Y-axis of the panel.
|
Time Distribution
| Date or time intervals during which
Data Integration Hub generated error events.
Appears on the X-axis of the panel.
|
Average Line
| Average, over the selected time frame, of the average number of final error events that
Data Integration Hub generated each day or each hour and the total number of error events for the selected time frame.
|
Daily/Hourly Average
| Overall error event average and the total number of events for the selected time frame. You can click the link to display the error events in the
Event List page.
|
Export as CSV
| Saves the data in the report as a CSV file.
|
