Table of Contents

Search

  1. Preface
  2. Part 1: Introducing Operational Insights
  3. Part 2: Monitoring Informatica Intelligent Cloud Services
  4. Part 3: Monitoring on-premises applications

Operational Insights

Operational Insights

View key job metrics

View key job metrics

You can view key job metrics, such as the number of records processed, for ingress, egress, match, and merge jobs. To view job metrics, use the
Ingress
,
Egress
,
Match
, and
Merge
tabs.
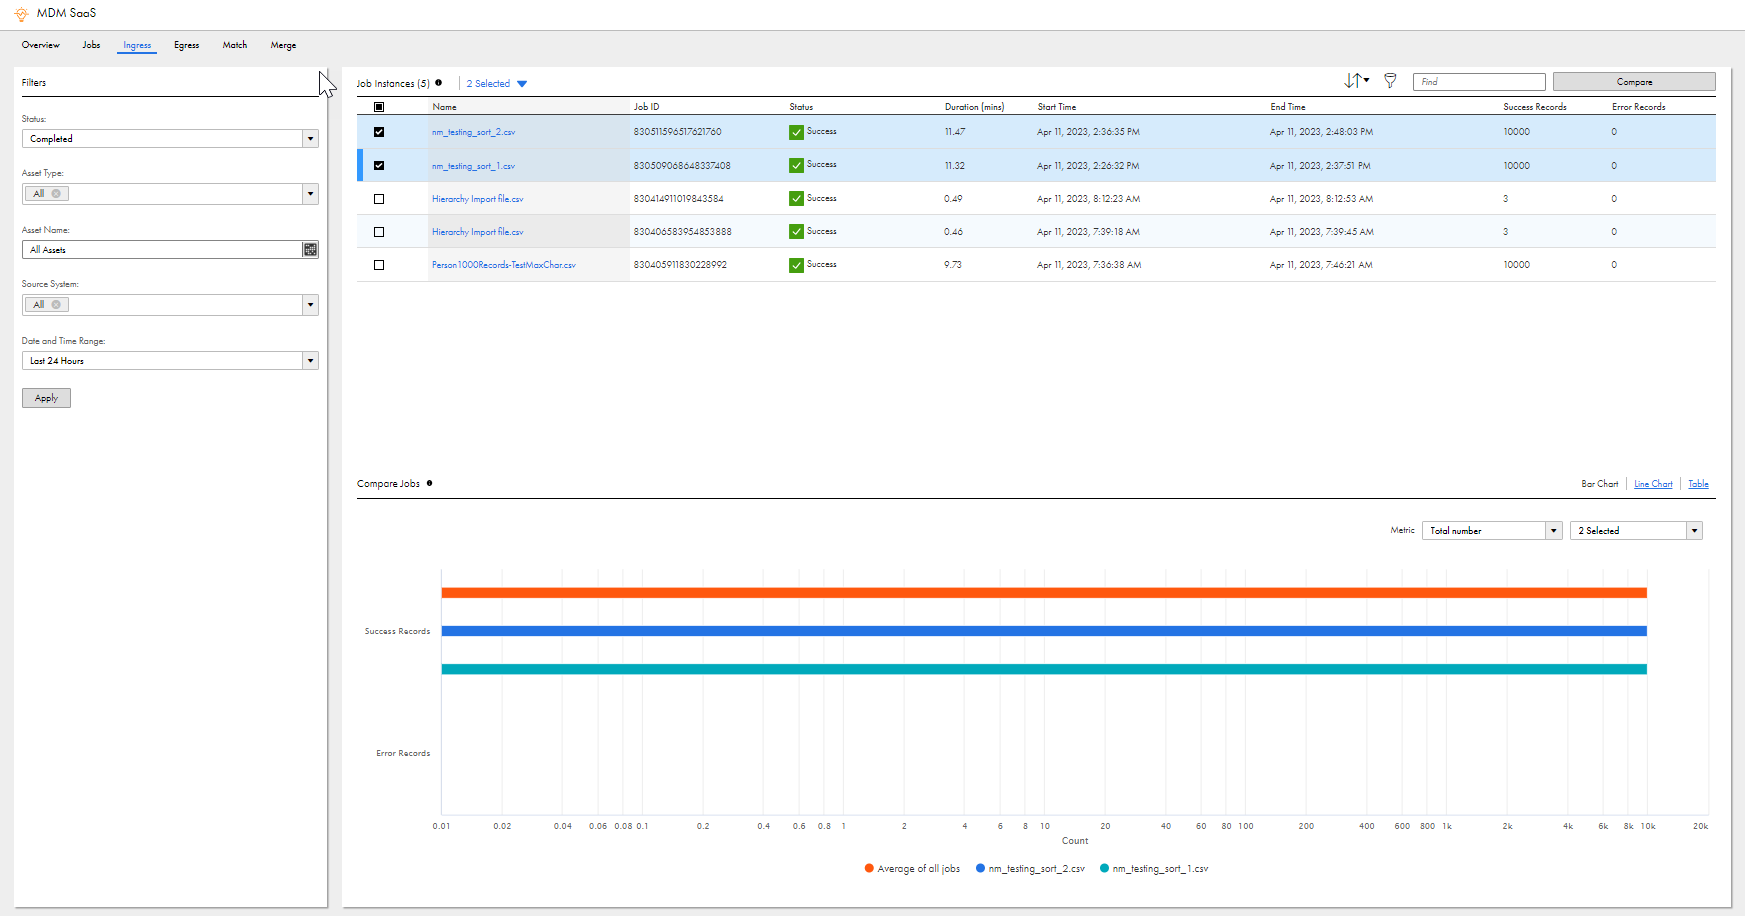
The following image shows the
Ingress
tab with key metrics of ingress jobs:
The Ingress tab shows key metrics and a comparison of jobs using the following panels: Job Instances and Compare Jobs.
You can view the status, start time, end time, duration, and metrics of a job. The metrics are specific to each job type. You can also sort and filter the jobs.
The following table describes the job filters:
Filter
Description
Status
Filters the job details based on the selected job status.
Asset Type
Filters the job details based on the selected asset type.
Asset Name
Filters the job details based on the selected asset name. The values depend on the assets in your organization.
Source System
Filters the job details based on the selected source system for an ingress job. The values depend on the source systems from which your organization gets data.
Date and Time Range
Applicable to completed jobs. Filters the job details based on the selected date and time range.
You can choose to set a custom date and time range.
You can also filter the jobs by job ID, status, start time, end time, duration, and metrics of a job. To specify a filter, click
Filter
, then click
Add Filter
and select the property to filter by.

0 COMMENTS

We’d like to hear from you!