Table of Contents

Search

  1. Preface
  2. Understanding Domains
  3. Managing Your Account
  4. Using Informatica Administrator
  5. Using the Domain View
  6. Domain Management
  7. Nodes
  8. High Availability
  9. Connections
  10. Connection Properties
  11. Schedules
  12. Domain Object Export and Import
  13. License Management
  14. Monitoring
  15. Log Management
  16. Domain Reports
  17. Node Diagnostics
  18. Understanding Globalization
  19. Appendix A: Code Pages
  20. Appendix B: Custom Roles
  21. Appendix C: Informatica Platform Connectivity
  22. Appendix D: Configure the Web Browser

Administrator Guide

Administrator Guide

Manage Tab - Domain View

Manage Tab - Domain View

The
Domain
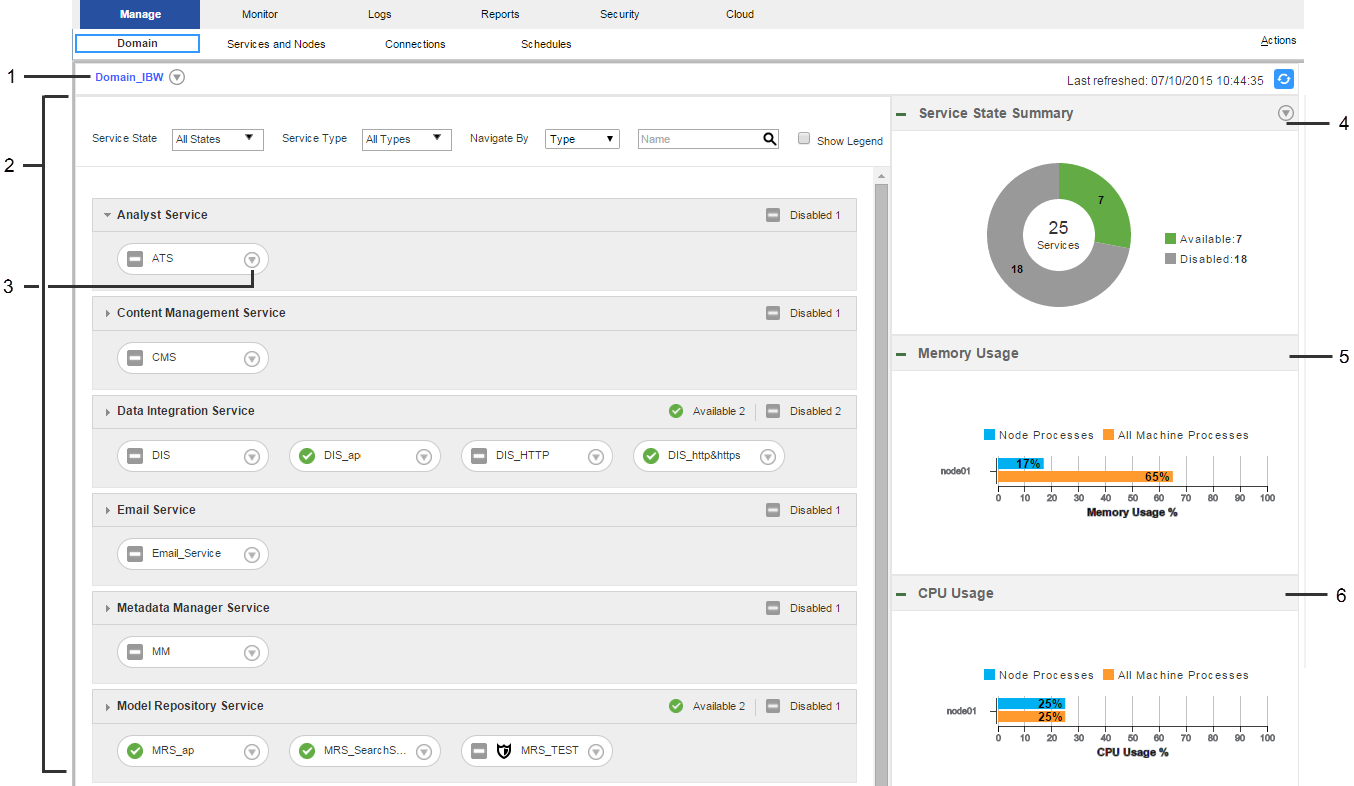
view displays an overview of the domain and its contents. You can use the domain view to monitor the domain status, resource consumption, and events. You can also perform domain actions, such as enabling and disabling services.
The following image shows the
Domain
view on the
Manage
tab:
The Domain view on the Manage tab in the Administrator tool. Lists the domain, services, nodes, and grids in the contents panel on the left. On the right, the view contains three panels. The first panel is a doughnut chart that displays the state of the services and the number of services with each state. Underneath the doughnut chart are two bar charts that display memory and CPU usage bar charts that compare resource usage.
  1. Domain Actions menu
  2. Contents panel
  3. Object Actions menu
  4. Service State Summary
  5. Memory usage indicator
  6. CPU usage indicator
The
Domain
view has the following components:
Domain Actions menu
Use the Domain Actions menu to view more information about the domain or shut down the domain.
Use the Domain Actions menu to perform the following tasks:
  • View Properties. Open the Services and Nodes view and display the properties for the domain.
  • View History. Open the History view and display domain events from the last day.
  • View Logs. Open the Logs tab and display Service Manager log events from the last day.
  • View Command History. Open the Command History panel and display the 50 most recent service lifecycle commands that were issued from the Administrator tool.
  • Shut Down Domain.
Contents panel
Displays domain objects and their states. Domain objects include services, nodes, and grids.
The following table describes the methods that you can use to view objects in the contents panel:
Method
Description
Service State
Filter services by the following states:
  • All states
  • Available
  • Unavailable
  • Disabled
Service Type
Filter some or all services in the domain.
Navigate by
Group objects by node, type, or folder.
Search
Search for an object by name. You can use an asterisk (*) as a wildcard character in this field.
Show Legend
View a list of state icons and descriptions.
Object Actions menus
Objects in the contents panel have Actions menus. Use the Actions menus to view information about domain objects or perform common tasks. The information you can view and the tasks that you can perform vary depending on which object you select.
Use the service Actions menu to perform the following tasks:
  • View Properties. Open the Services and Nodes view and display the properties for the service.
  • View History. Open the History view and display service events from the last day.
  • View Logs. Open the Logs tab and display service log events from the last day.
  • View Dependencies. Open the Dependency graph and display direct dependencies for the service.
  • Recycle Service.
  • Enable or Disable Service.
Use the node Actions menu to perform the following tasks:
  • View Properties. Open the Services and Nodes view and display properties for the node.
  • View History. Open the History view and display node events from the last day.
  • View Dependencies. Open the Dependency graph and display direct dependencies for the node.
  • Shut Down Node
Use the grid Actions menu to perform the following tasks:
  • View Properties. Open the Services and Nodes view and display properties for the grid.
  • View Dependencies. Open the Dependency graph and display direct dependencies for the grid.
Service State Summary
Doughnut chart that shows the number and state of the services in the domain. When you click a state in the chart, the contents panel displays services with that state.
Resource usage indicators
Bar charts that compare resource usage of a domain process to resource usage of all processes on the machine. The Domain view contains a memory usage indicator and a CPU usage indicator.
Manage tab Actions menu
Access help for the Domain view.

0 COMMENTS

We’d like to hear from you!