Operational Insights
- Operational Insights
- All Products

Property
| Description
|
|---|---|
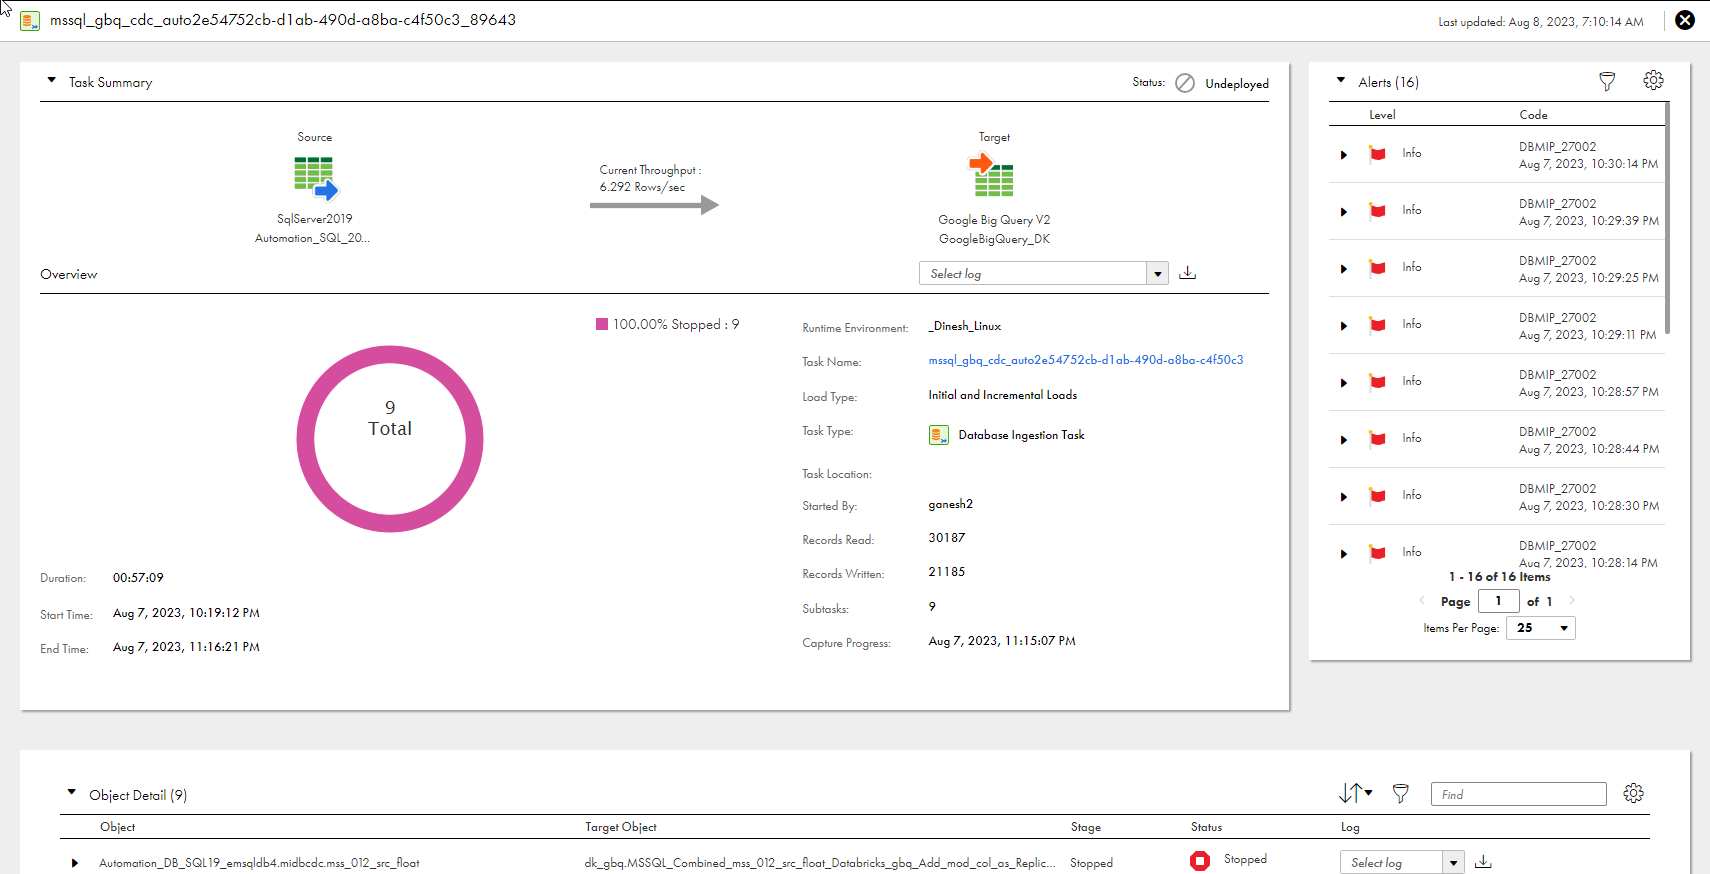
Runtime Environment
| The name of the runtime environment that the job uses to run.
|
Task Name
| The name of the associated ingestion task. You can click the task-name link to view or edit task details in Mass Ingestion, if necessary. If you edit the task, you must redeploy it for the updated task definition to be used for a job.
|
Load Type
| The type of load operation that the job performs. Options are:
|
Task Type
| The type of task, which is
Database Ingestion Task .
|
Task Location
| The project or project folder that contains the ingestion task definition.
|
Started By
| The name of the user who started the job.
|
Records Read
| The number of records that were read from the source.
For a combined initial and incremental load job, the Records Read count might be greater than the total number of object-level DML change records written. This behavior occurs because the initial load or resync processing always starts after change data capture has begun. As a result, some change records are included in the Records Read count and then discarded before initial load or resync processing starts. These discarded records cause the Records Write count to be less than the Records Read count.
|
Records Written
| The number of records that were successfully replicated to the target.
The Records Written value might be different from the Records Read value if source records are discarded. For example, in a combined initial and incremental load job, change records read from the source before the initial unload phase completes are discarded because they're not yet needed.
|
Subtasks
| The number of subtasks that the
database ingestion job used to replicate data from source tables to the target. When a job runs, it uses a separate subtask to process each source table.
|
Capture Progress
| For incremental load and combined initial and increment load jobs, the date and time in the source change stream to which capture processing has progressed, as shown in the time zone of the user profile.
|
Schedule
| For initial load jobs, the name of the schedule that is used to run the job or "No schedule" if you run the job manually.
|
Duration (Lower left corner)
| The amount of time, in the hh:mm:ss format, that the job ran before it ended.
|
Start Time (Lower left corner)
| The date and time when the job was deployed.
|
End Time (Lower left corner)
| The date and time when the job ended because it completed processing, was stopped, or failed. This field is not displayed for running jobs
|
Column
| Description
|
|---|---|
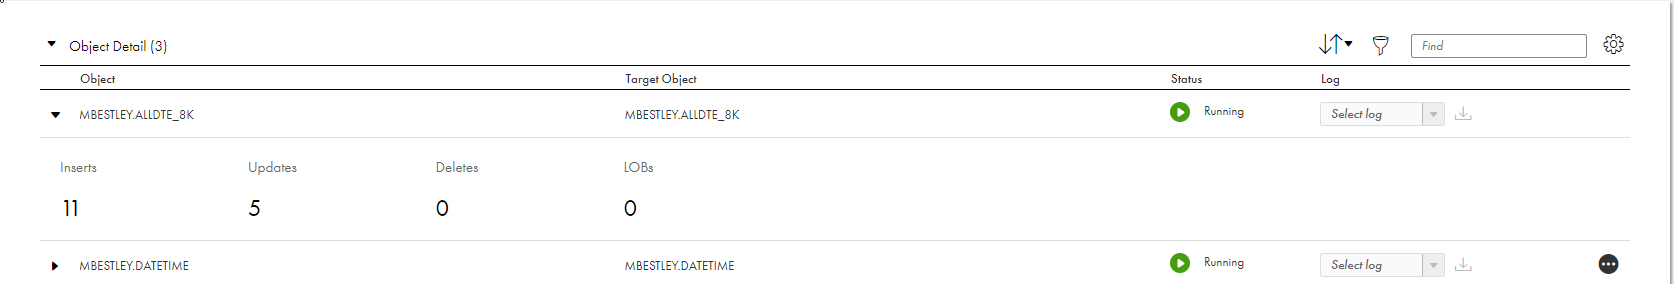
Object
| The name of the source table or view for which data was propagated to the target.
For an incremental load job or a combined initial and incremental load job, click the arrow icon to the left of the object name to display detailed counts of Inserts, Deletes, Updates, LOBs, and DDL statements processed. For a combined initial and incremental load job, the Unload Count field is also displayed to show the number of records that the initial load portion of processing read from the source. The following usage notes apply to the detailed CDC counts:
|
Target Object
| The name of the target object that is mapped to the source object.
|
Records Read
| For an initial load job, the number of records that were read from the source. For other load types, this information is available only at the job-level on the
Job Overview tab.
|
Records Written
| For an initial load job, the number of records that were successfully written to the target. For other load types, this information is available only at the job-level on the
Job Overview tab.
The Records Read value can be greater than the Records Written value if some records read from the source were discarded. For example, in a combined initial and incremental job, any source change records read before the initial unload phase of the job has completed are discarded.
|
Task Duration
| For an initial load job, the amount of time the subtask that processed the source table ran before it completed or was stopped. For other load types, this information is available only at the job-level on the
Job Overview tab.
When a job runs, it uses a separate subtask to process each source table.
|
Stage
| For a combined initial and incremental load job, this column shows the stage in the transition from initial load processing to CDC processing for the table-specific job subtask. This column does not appear for other load types.
The stage can be one of the following values:
Actions menu > Resync
For a subtask in a combined initial and incremental load job, if the subtask stage is
Normal and the subtask status is any status other than
Queued or
Starting , the Actions (...) menu is displayed on the right end of the subtask row. From the Actions menu, you can select
Resync to resynchronize the source and target objects. For more information, see "Resynchronizing source and target objects" in Mass Ingestion help.
|
Status
| The status of the job subtask for the source object.
If the job stops running, the subtask status reflects the status last collected before the job ended. For example, the job might be aborted but the subtask is in a Running status.
The state can be one of the following values:
If a DDL change occurs on a source table and then you resume the job, the table subtask state might not change as expected until the first DML operation occurs on the source table.
|
Log
| You can download a job execution log for a source object. The type and availability of the log depends on the load type and status. Options are:
To download a log, click the Download icon.
If you undeployed the job, you can download the log for a table only if the associated task has not been deleted.
For incremental load jobs, you can get the complete log and error log for the entire job run from the
Task Summary pane.
|
Column
| Description
|
|---|---|
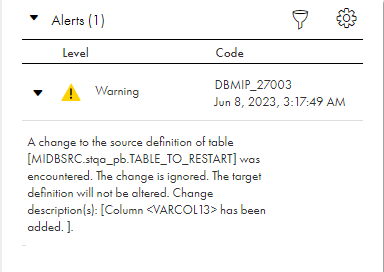
Level
| Severity level of the alert message, such as Critical or Warning.
|
Code
| Alphanumeric code that identifies the alert type followed by the date and time when the event occurred.
|
