Table of Contents

Search

  1. Preface
  2. Introduction
  3. Installation
  4. Design
  5. Operation

Troubleshooting

Troubleshooting

The DCE includes a low-level tracing/monitoring utility
dumpshr
, which Informatica Corporation support staff might ask you to run in some circumstances. It is used to view the call stacks of all DCE server and utility programs. It is enabled by setting an environment variable of the shell that is used to launch the servers/utilities.
Since
dumpshr
uses shared memory to communicate with the servers and utility programs, it must be run on the same machine as the processes that it is monitoring. On Unix make sure that at least 15MB of shared memory can be allocated (
SHMMAX
kernel parameter).

Enable Tracing

  1. Shutdown the DCE Server
  2. On Win32 platforms:
    set SSAOPTS=+t
    On Unix platforms:
    SSAOPTS=+t ; export SSAOPTS
  3. Restart the DCE Server from the command prompt in which you set the
    SSAOPTS
    environment variable:
    <DCE Installation Directory>\bin\ds

Disable Tracing

  1. Shutdown the DCE Server.
  2. On Win32 platforms:
    set SSAOPTS=
    On Unix platforms
    unset SSAOPTS
  3. Restart the DCE Server.

SSAOPTS environment variable

The following options may be set to enable trace and debugging features:
Option
Description
+t
Process/thread/stack tracing. Required for
dumpshr
operation. Also used to enable server stack trace for crashes (found in
dcexxsv.dbg
).
+L
Logs all error messages to
*.dbg
files. These files are either in the server work directory or in
/tmp
.
+u
logs process resource usage (threads, sockets, stack space, etc) to
*.dbg
files
Multiple options are enabled by concatenating them, eg.
SSAOPTS=+tL
(note these options are case sensitive).

Running dumpshr

Non-Interactive Mode

To run
dumpshr
in non-interactive mode, run
%SSABIN%\dumpshr -p
This will print the active program function stacks to the console (
stdout
). The output can be redirected to a file using normal shell commands, eg.
%SSABIN%\dumpshr -p >dumpshr.log

Interactive Mode

dumpshr
can also be run in interactive mode to observe the interaction between server threads and utility programs. To execute in the interactive mode run command,
%SSABIN%\dumpshr >dumpshr.log
This will display a list of DCE processes. For each process,
dumpshr
displays the process id (
pid
) and the time it started (yyyymmddhhmmss). Each thread belonging to that process is summarized with a line showing:
  • thread id (the main thread is 256)
  • stack depth
  • source module
  • line number in source module
  • function entry ("E"), exit ("X"), progress ("P")
  • function name
The following commands are accepted:
Command
Description
Refresh Rate
Specifies how often the display is updated. The default is 10 seconds. To change the rate (in seconds), type one of the numbers ’1’ to ’9’ or ’0’ for 10 seconds.
Stack
A full stack for each thread can be displayed with the ’s’ key. This toggles between summary and full stack modes.
Print
The ’
p
’ key will write a fully expanded stack to
stdout
. If you started the utility by redirecting the output the snapshot is written to the log file.
Quit
The ’
q
’ key will exit the
dumpshr
utility.

Cleaning Up

On the Win32 platform,
dumpshr
uses Memory Mapped Files as its shared memory mechanism. Memory is allocated from the Windows swap file and is released when the last program using the memory terminates. As such, there is no special requirement to clean up.
On Unix platforms,
dumpshr
allocates shared memory as an IPC resource. DCE requires the kernel parameter
SHMMAX
to be set to at least 15MB. On Unix, shared memory is not released when programs using it terminate. This is a nice feature because any programs that core dump will leave their call stack in the shared memory. At a later stage,
dumpshr
can be used to display what the program was doing at the point of failure. However, the disadvantage of this is that when programs terminate abnormally the memory must be cleaned up manually. Shared memory can be deleted by running
$SSABIN/dumpshr -d
You can also delete IPC resources using the Unix utilities
ipcs
and
ipcrm
. DCE creates its shared memory and semaphore using the key
0x55A00001
. Future releases will increment this number when the layout of the shared memory changes.

Handling of Common Errors

This is a list of common errors encountered in DCE. This should help the user to resolve them without the need to call an Informatica Corporation technical specialist.

Rulebase is locked

The Console Client returns an error message such as this when trying to connect to a Rulebase:
An Error Has Occurred: Rulebase is locked Rulebase opened at Fri Feb 26 13:17:56 2010 Server started at Fri Feb 26 13:17:46 2010 Rulebase ’sdb:file:c:\a20i\dce\rule’ is either corrupt or in use by ssa.informatica.com IP=203.2.203.101 on port=2668 IS ANOTHER RULEBASE SERVER RUNNING? ssacs_RulebaseStatus: rulebase_open ’sdb:file:c:\a20i\dce\rule’ failed -20111109
Rulebase is locked by another running Rulebase Server. If there’s no other Rulebase Server running, then the Rulebase file is corrupted. This could happen if the DCE Server is shutdown incorrectly, either by the user or some other external occurrence like computer has been powered down abruptly.
Correction:
There are no repair utilities for corrupted Rulebases. The user must delete the present Rulebase files
rule.db
and
rule.ndx
and all other related Project files and re-start the Project from the beginning.

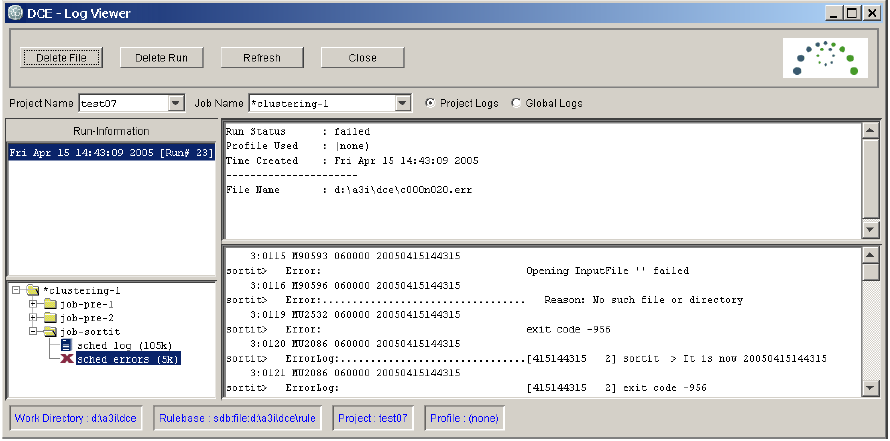
Opening InputFile ’ ’ failed

The Sort step fails with the message "Opening InputFile ’ ’ failed" followed by the message "Reason: No such file or directory".
The sort step cannot find the input file to sort. Usually this condition occurs when an option for the preceding step is missing.
For example, the Clustering Schedule calls for a job of type Pre before the Sort job but there is no option Format in the Clustering options list.
Correction:
  • Check the Clustering options list for missing options.

Opening InputFile ’drive:<path><filename>’ failed

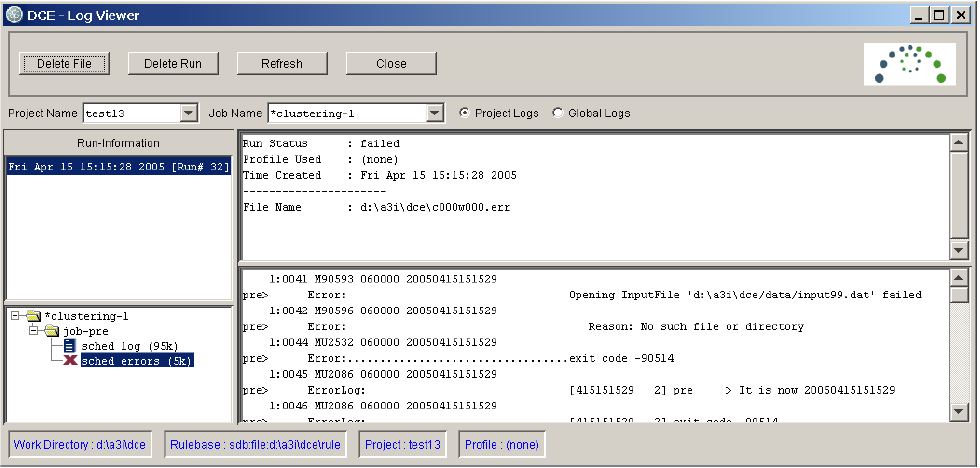
The first step in a Clustering process fails to open the input file named in the message, followed by the message
"Reason: No such file or directory":
The input file as named in the message could not be found. The file name or path could be misspelled or the file could be missing.
Correction:
Check the path and name of the file and if the file exists.

0 COMMENTS

We’d like to hear from you!