Table of Contents

Search

  1. Preface
  2. Introduction to Informatica Big Data Management
  3. Mappings in the Hadoop Environment
  4. Mapping Sources in the Hadoop Environment
  5. Mapping Targets in the Hadoop Environment
  6. Mapping Transformations in the Hadoop Environment
  7. Processing Hierarchical Data on the Spark Engine
  8. Configuring Transformations to Process Hierarchical Data
  9. Processing Unstructured and Semi-structured Data with an Intelligent Structure Model
  10. Stateful Computing on the Spark Engine
  11. Monitoring Mappings in the Hadoop Environment
  12. Mappings in the Native Environment
  13. Profiles
  14. Native Environment Optimization
  15. Cluster Workflows
  16. Connections
  17. Data Type Reference
  18. Function Reference
  19. Parameter Reference

Big Data Management User Guide

Big Data Management User Guide

YARN Web User Interface

YARN Web User Interface

You can view the applications that ran on a cluster in the YARN web user interface. Click the Monitoring URL for Blaze, Hive, or Spark jobs to access the YARN web user interface.
Blaze, Spark, and Hive engines run on the Hadoop cluster that you configure in the Hadoop connection. The YARN web user interface shows each job that the engine runs as a YARN application.
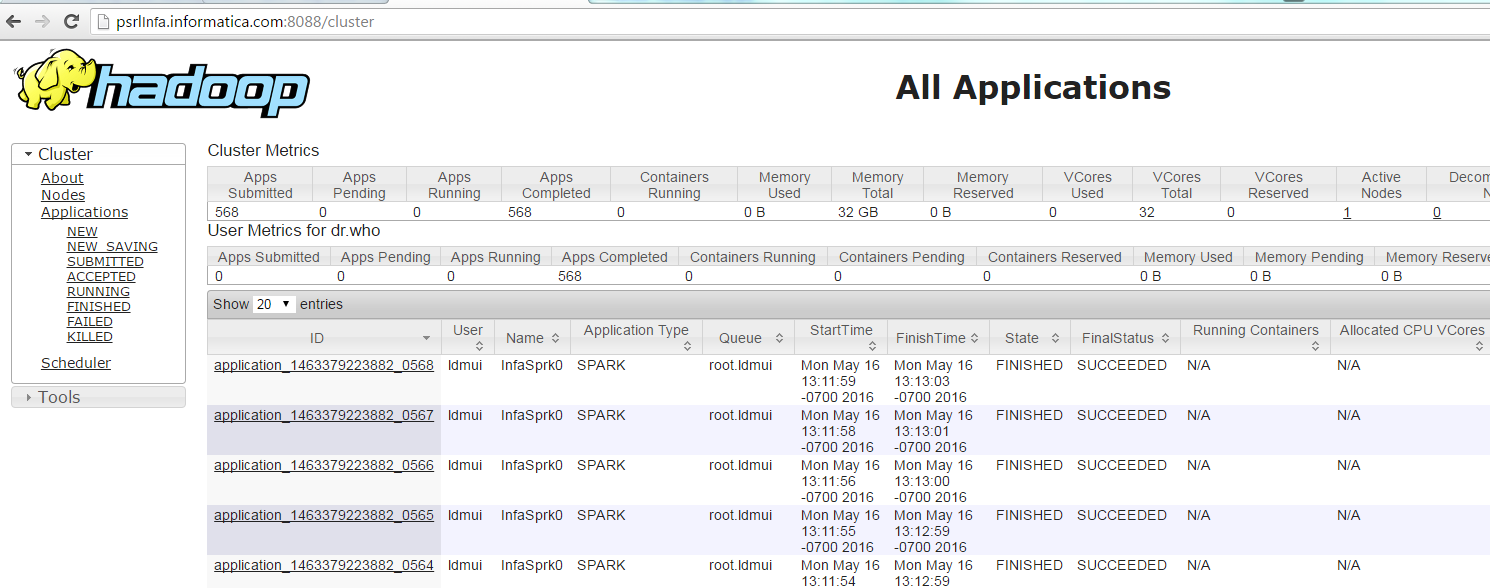
The following image shows the Application Monitoring page of the YARN web user interface:
The YARN web user interface shows a list of the applications that ran on a cluster.
The
Application Type
indicates which engine submitted the YARN application.
The application ID is the unique identifier for the application. The application ID is a link to the application summary. The URL is the same as the Monitoring URL in the Administrator tool.
Click the
Logs
link in the application summary to view the application logs on the Hadoop cluster.
The amount of information in the application logs depends on the tracing level that you configure for a mapping in the Developer tool. The following table describes the amount of information that appears in the application logs for each tracing level:
Tracing Level
Messages
None
The log displays FATAL messages. FATAL messages include non-recoverable system failures that cause the service to shut down or become unavailable.
Terse
The log displays FATAL and ERROR code messages. ERROR messages include connection failures, failures to save or retrieve metadata, service errors.
Normal
The log displays FATAL, ERROR, and WARNING messages. WARNING errors include recoverable system failures or warnings.
Verbose initialization
The log displays FATAL, ERROR, WARNING, and INFO messages. INFO messages include system and service change messages.
Verbose data
The log displays FATAL, ERROR, WARNING, INFO, and DEBUG messages. DEBUG messages are user request logs.

0 COMMENTS

We’d like to hear from you!