Table of Contents

Search

  1. Preface
  2. Introduction to Informatica Big Data Management
  3. Mappings in the Hadoop Environment
  4. Mapping Sources in the Hadoop Environment
  5. Mapping Targets in the Hadoop Environment
  6. Mapping Transformations in the Hadoop Environment
  7. Processing Hierarchical Data on the Spark Engine
  8. Configuring Transformations to Process Hierarchical Data
  9. Processing Unstructured and Semi-structured Data with an Intelligent Structure Model
  10. Stateful Computing on the Spark Engine
  11. Monitoring Mappings in the Hadoop Environment
  12. Mappings in the Native Environment
  13. Profiles
  14. Native Environment Optimization
  15. Cluster Workflows
  16. Connections
  17. Data Type Reference
  18. Function Reference
  19. Parameter Reference

Big Data Management User Guide

Big Data Management User Guide

Hive Engine Logs

Hive Engine Logs

The Hive engine logs appear in the LDTM log and the Hive session log.
You can find the information about Hive engine log events in the following log files:
LDTM log
The LDTM logs the results of the Hive queries run for the mapping. You can view the LDTM log from the Developer tool or the Administrator tool for a mapping job.
Hive session log
When you have a Hive script in the Hive execution plan of a mapping, the Data Integration Service opens a Hive session to run the Hive queries.
A Hive session updates a log file in the following directory on the Data Integration Service node:
<Informatica installation directory>/tomcat/bin/disTemp/
.
The full path to the Hive session log appears in the LDTM log.
You can view information about DAG vertices in the Tez job link and in the session log. The Tez layout and views might differ based on the selected configurations for the Tez specific properties.
The following image shows the Tez Hive query properties in Tez:
The Tez Hive query properties that appears under the Hive Queries are as follows: Query ID, User, DAG ID, Tables Read, Tables Written, App ID, Queue, and Execution Mode.
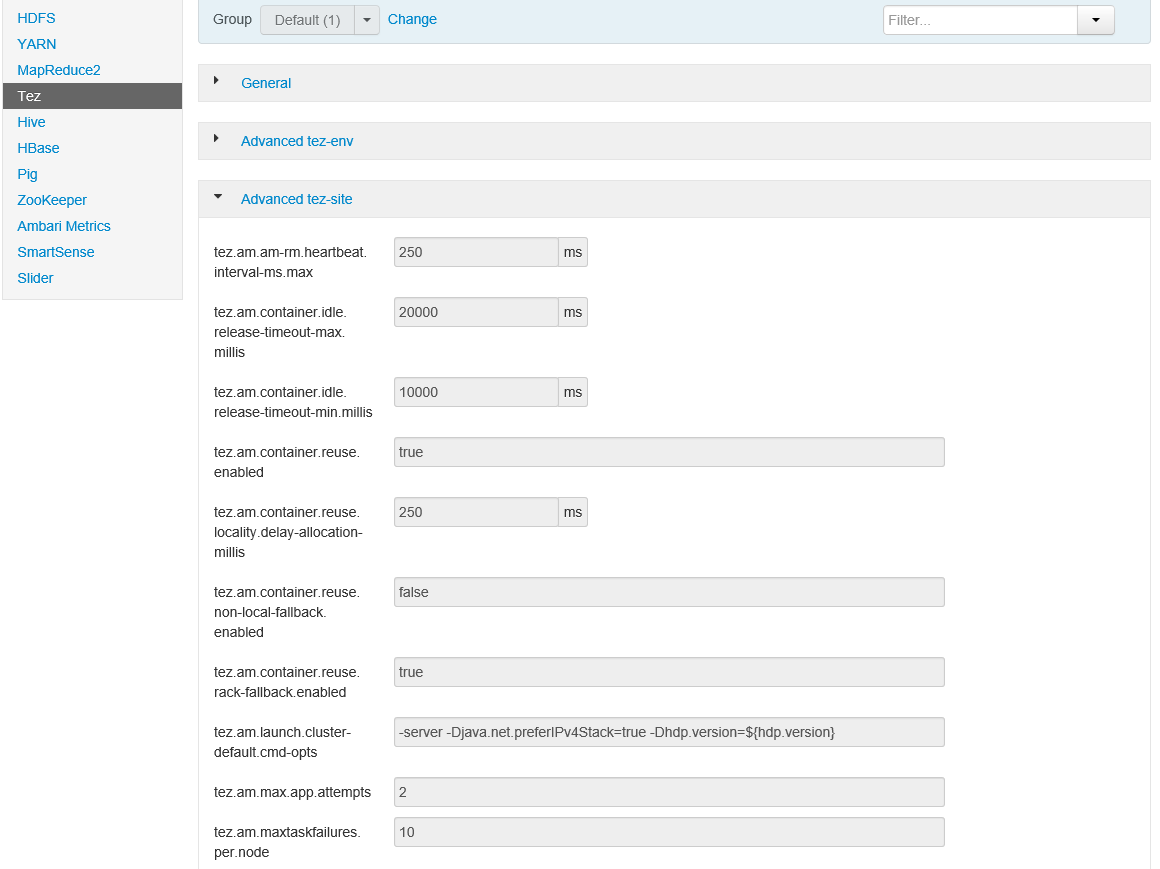
The following image shows the advanced Tez properties in Tez:
Tez properties appears under several different property categories, such as General, Advanced tez-env, and Advanced tez-site. The Advanced tez-site properties list values for the following properties: tez.am.am-rm.heartbeat.interval-ms.max, tez.am.container.idle.release-timeout-max.millis, tez.am.container.idle.release-timeout-min.millis, tez.am.container.reuse.enabled, tez.am.container.reuse.locality.delay-allocation-millis, tez.am.container.reuse.non-local-fallback.enabled, tez.am.container.reuse.rack-fallback enabled, tez.am.launch.cluster-default.cmd-opts, tez.am.max.app.attempts, and tez.am.maxtaskfailures.per.node.
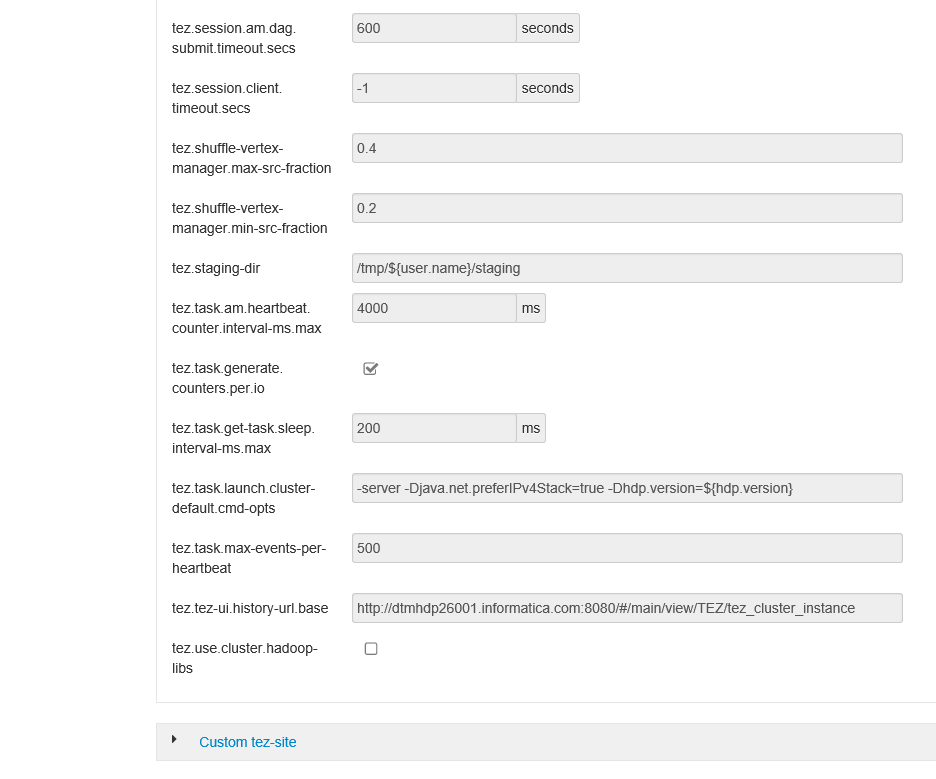
The following image shows the advanced Tez properties related to DAG, vertex, and task counts:
The following Tez properties are listed: tez.session.am.dag.submit.timeout.secs, tez.session.client.timeout.secs, tez.shuffle-vertex-manager.max-src-fraction, tez.shuffle-vertex-manager.min-src-function, tez.staging-dir, tez.task.am.heartbeat.counter.interval-ms.max, tez.task.generate.counters.per.io, tez.task.get-task.sleep.interval-ms.max, tez.task.launch.cluster-default.cmd-opts, tez.task.max-events-per-heartbeat, tez.tez-ui.history-url.base, and tez.use.cluster.hadoop-libs.
The monitoring properties appear in the Hive session log under Mapping Status Report when enabled for verbose data or verbose initialization for Tez.
To get DAG tracking URL in the workflow log, you have to update the tez.tez-ui.history-url.base with the following value in the HDInsights cluster:
<host address>:<port>/#/main/view/TEZ/tez_cluster_instance
.
For example, a complete DAG URL is as follows:
https://ivlhdp584.informatica.com:8443/#/main/view/TEZ/tez_cluster_instance?viewPath=%2F%23%2Fdag%2Fdag_1520917602092_9282_1

Back to Top

0 COMMENTS

We’d like to hear from you!