Table of Contents

Search

  1. Preface
  2. Document Processing
  3. Operation Console
  4. Partners and Profiles
  5. On-Boarding Checklists
  6. Endpoints
  7. MFT Connections
  8. MFT Web Users
  9. Events and Event Monitoring
  10. Event Monitors
  11. Reconciliations
  12. Event Resubmission
  13. Audit and Authorization
  14. Advanced Exception Handling
  15. Dashboard and Reports
  16. Service Level Agreement Management
  17. Glossary

Error Event Distribution Report

Error Event Distribution Report

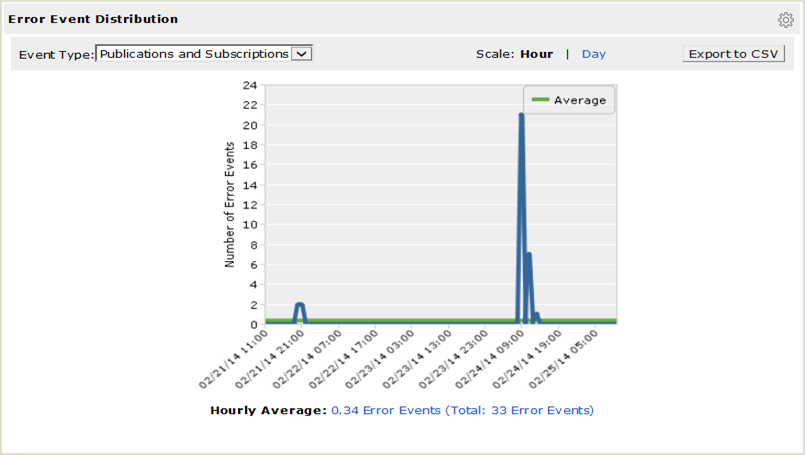
The Error Event Distribution report displays the total number of publications and subscriptions that reached their final state with an Error status during the selected time frame, per hour or per day. Use the report to identify error event creation peaks, and identify time periods that might require further attention.
The following image shows the Error Event Distribution report:
The following table describes the Error Event Distribution report elements:
Element
Description
Event Type
Type of events to display. You can choose one of the following options:
  • Publications and Subscriptions.
  • Publications Only.
  • Subscriptions Only.
Scale
Granularity of the calculations. You can choose one of the following options:
  • Hour. Displays the number of error events at hourly intervals as points on the graph.
  • Day. Displays the number of error events at daily intervals as points on the graph.
If you select a time frame filter longer than seven days, you can only view error event distribution on a day scale.
Number of Error Events
Number of error events that
B2B Data Exchange
generated during the selected time frame.
Appears on the Y-axis of the panel.
Time Distribution
Date or time intervals during which
B2B Data Exchange
generated error events.
Appears on the X-axis of the panel.
Average Line
Average, over the selected time frame, of the average number of final error events that
B2B Data Exchange
generated each day or each hour and the total number of error events for the selected time frame.
Daily/Hourly Average
Overall error event average and the total number of events for the selected time frame. You can click the link to display the error events in the
Event List
page.
Export as CSV
Saves the data in the report as a CSV file.

0 COMMENTS

We’d like to hear from you!