Table of Contents

Search

  1. Preface
  2. Introduction to Data Validation Option
  3. Repositories
  4. XML Data Source
  5. Tests for XML Data Sources
  6. Connections
  7. Expressions
  8. Table Pairs
  9. Tests for Table Pairs
  10. Single-Table Constraints
  11. Tests for Single-Table Constraints
  12. Examples of Tests from Spreadsheets
  13. SQL Views
  14. Lookup Views
  15. Join Views
  16. Aggregate Views
  17. Business Intelligence and Reporting Tools Reports
  18. Dashboards
  19. DVOCmd Command Line Program
  20. Troubleshooting
  21. Datatype Reference
  22. Reporting Views
  23. Metadata Import Syntax
  24. Jasper Reports
  25. Glossary

Data Validation Option User Guide

Data Validation Option User Guide

Aggregate View Example

Aggregate View Example

You want to aggregate the sales of a product by a particular date and validate the sales against the data in the target table. Use an aggregate view to aggregate data stored in the source and validate the sales against data stored in the target.
The following table displays sample data from a flat file source:
DATE
PRODUCT
QUANTITY
PRICE
01-29-2014
A
100
200
01-29-2014
B
800
10
01-29-2014
C
300
30
01-29-2014
D
200
20
01-30-2014
A
200
200
01-30-2014
B
200
700
01-30-2014
E
50
30
01-30-2014
D
100
800
01-31-2014
B
900
100
01-31-2014
C
800
900
01-31-2014
D
300
1100
02-01-2014
E
700
300
02-02-2014
A
700
300
The following table displays sample data from a target table:
PRODUCT
REVENUE
A
270000.00
B
320000.00
C
730000.00
D
530000.00
E
225000.00
To aggregate data stored in the source and validate the sales against data stored in the target, perform the following steps:
  1. Create the aggregate view.
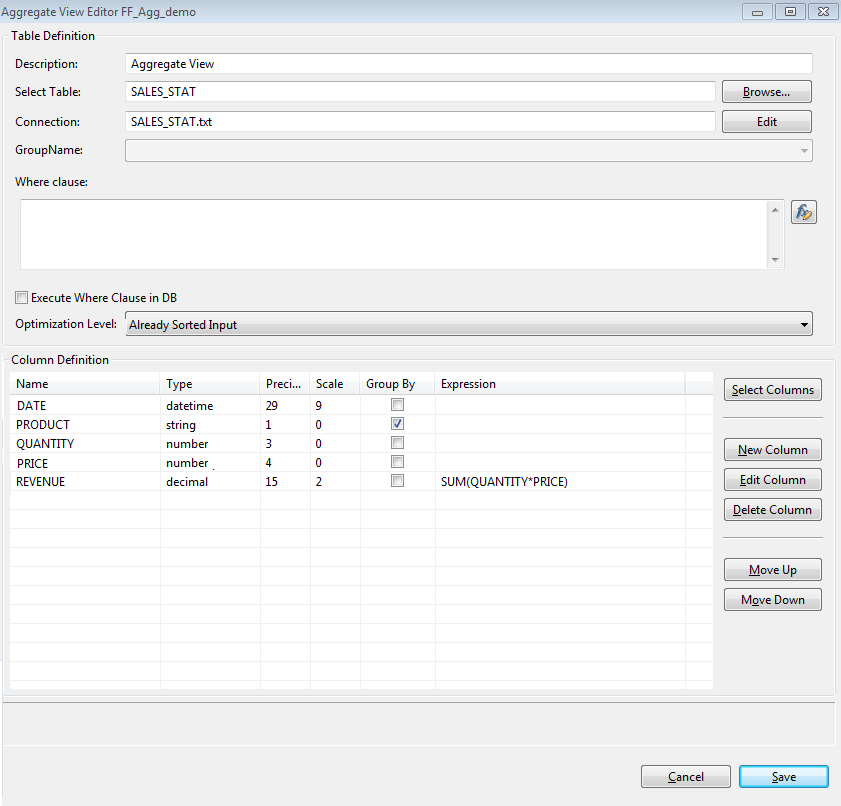
    In the aggregate view editor, specify the aggregate view description, source table, and connection. Select the fields that you require. Group by the product and create an expression to calculate the revenue. Include the following fields in the aggregate view:

      DATE

      PRODUCT

      QUANTITY

      PRICE

      REVENUE

    Use the following expression to calculate revenue:
    SUM(QUANTITY*PRICE)
    The following image shows the aggregate view editor:
    The aggregate view editor shows the description and name of the source table, the connection type, and the columns that are part of the view. The column definition area shows that DATE and REVENUE_CALCULATED are the columns in the aggregate view.
  2. Create the table pair.
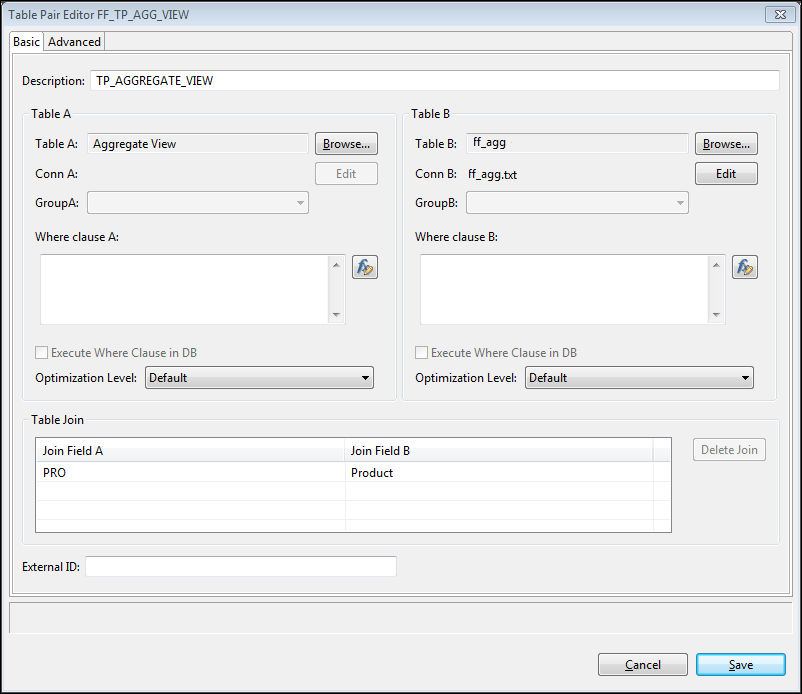
    Create a table pair using the aggregate view and the target table. Create a join relationship between the product in the aggregate view and the product in the target table.
    The following image shows the table pair editor:
  3. Create a VALUE test.
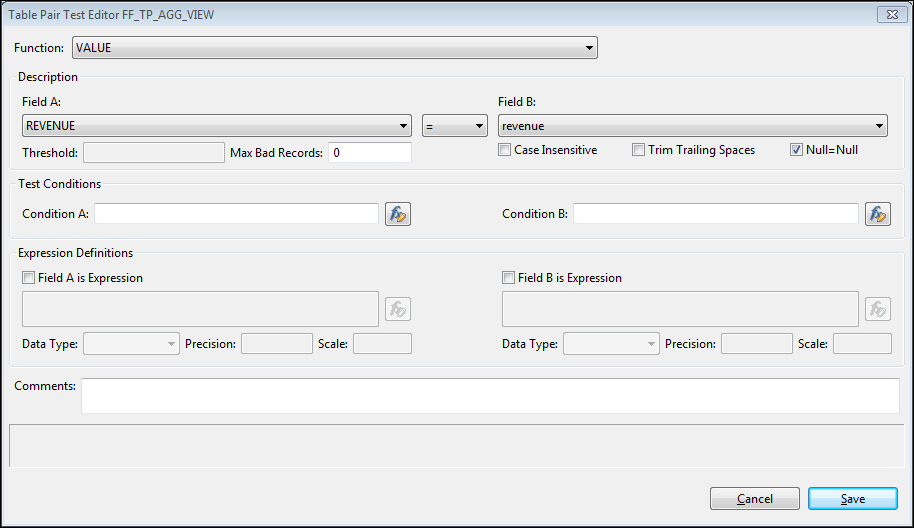
    To compare revenue in the aggregate view and the target table, create a VALUE test. The test compares the values of the fields in the aggregate view and the target table, and determines whether they are the same.
    The following image shows the table pair test editor:
    The test fails if the calculated revenue does not match the revenue in the target table.

0 COMMENTS

We’d like to hear from you!