Multidomain MDM
- Multidomain MDM 10.3 HotFix 2
- All Products

Name | View | Description |
|---|---|---|
Hierarchical | 
| The hierarchic layout highlights the main direction or flow within a directed graph. |
Organic | 
| The organic layout is a multi-purpose layout for undirected graphs, based on the force-directed layout paradigm. |
Orthogonal | 
| The orthogonal layout represents complex networks using the topology-shape-metrics approach. |
Circular | 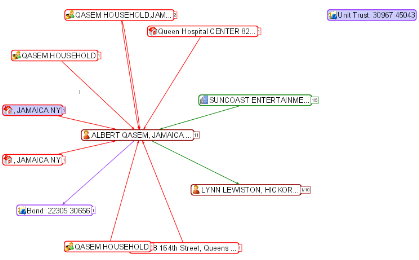
| The circular layout produces layouts that emphasize group and tree structures within a network. |
Tree | 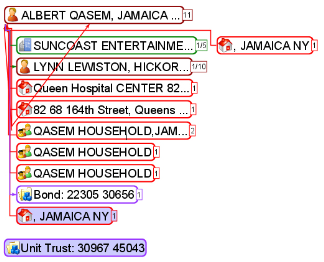
| The tree layout creates a top-down graph with branches for subsidiary information (tree-structured graph). |
