Table of Contents

Search

  1. Preface
  2. Introduction to Informatica Big Data Management
  3. Mappings in the Hadoop Environment
  4. Mapping Sources in the Hadoop Environment
  5. Mapping Targets in the Hadoop Environment
  6. Mapping Transformations in the Hadoop Environment
  7. Processing Hierarchical Data on the Spark Engine
  8. Configuring Transformations to Process Hierarchical Data
  9. Processing Unstructured and Semi-structured Data with an Intelligent Structure Model
  10. Stateful Computing on the Spark Engine
  11. Monitoring Mappings in the Hadoop Environment
  12. Mappings in the Native Environment
  13. Profiles
  14. Native Environment Optimization
  15. Cluster Workflows
  16. Connections
  17. Data Type Reference
  18. Function Reference
  19. Parameter Reference

Big Data Management User Guide

Big Data Management User Guide

Aggregate Function as Window Function Example

Aggregate Function as Window Function Example

You work for a human resources group and you want to compare each of your employees' salaries with the average salary in his or her department:
The following table lists the department names, the employee identification number, and the employee's salary:
Department
Employee
Salary
Development
11
5200
Development
7
4200
Development
9
4500
Development
8
6000
Development
10
5200
Personnel
5
3500
Personnel
2
3900
Sales
3
4800
Sales
1
5000
Sales
4
4800
You set an unbounded frame to include all employees in the calculation, and you define an aggregate function to calculate the difference between each employee's salary and the average salary in the department.

Windowing Properties

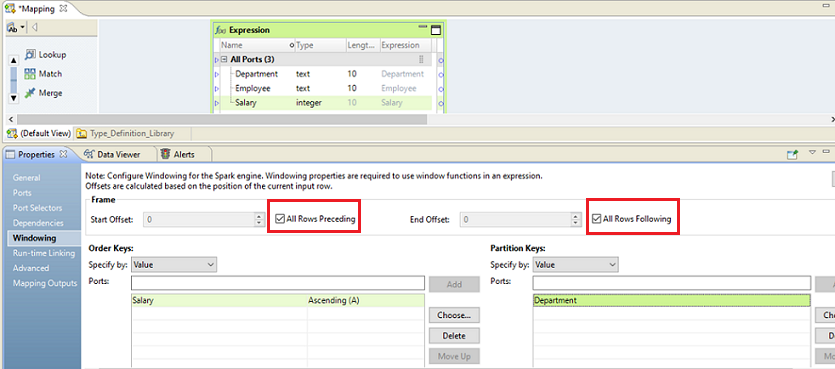
You define the following windowing properties on the Windowing tab:
Property
Description
Order key
Salary Ascending
. Arranges the data by increasing salary.
Partition key
Department
. Groups the rows according to department.
Start offset
All Rows Preceding
End offset
All Rows Following
With an unbounded frame, the aggregate function includes all partition rows in the calculation.
For example, suppose the current row is the third row. The third row is in the "Development" partition, so the frame includes the third row in addition to all rows before and after the third row in the "Development" partition.
The following image shows the windowing properties you configure in the Expression transformation:
On the Windowing tab, ascending salary is selected as the order key and department is selected as the partition key. The frame is All Rows Preceding and All Rows Following.

Window Function

An aggregate function acts as a window function when you configure the transformation for windowing.
You define the following aggregate function to calculate the difference between each employee's salary and the average salary in his or her department:
Salary - AVG ( Salary ) = Salary_Diff

Output

The transformation produces the following salary differences:
Department
Employee
Salary
Salary_Diff
Development
11
5200
-820
Development
7
4200
-520
Development
9
4500
180
Development
8
6000
180
Development
10
5200
980
Personnel
5
3500
200
Personnel
2
3900
200
Sales
3
4800
-66
Sales
1
5000
-66
Sales
4
4800
134
You can identify which employees are making less or more than the average salary for his or her department. Based on this information, you can add other transformations to learn more about your data. For example, you might add a Rank transformation to produce a numerical rank for each employee within his or her department.

0 COMMENTS

We’d like to hear from you!