Table of Contents

Search

  1. Preface
  2. Introduction to Informatica Data Engineering Integration
  3. Mappings
  4. Mapping Optimization
  5. Sources
  6. Targets
  7. Transformations
  8. Python Transformation
  9. Data Preview
  10. Cluster Workflows
  11. Profiles
  12. Monitoring
  13. Hierarchical Data Processing
  14. Hierarchical Data Processing Configuration
  15. Hierarchical Data Processing with Schema Changes
  16. Intelligent Structure Models
  17. Blockchain
  18. Stateful Computing
  19. Appendix A: Connections Reference
  20. Appendix B: Data Type Reference
  21. Appendix C: Function Reference

Monitoring a Mapping

Monitoring a Mapping

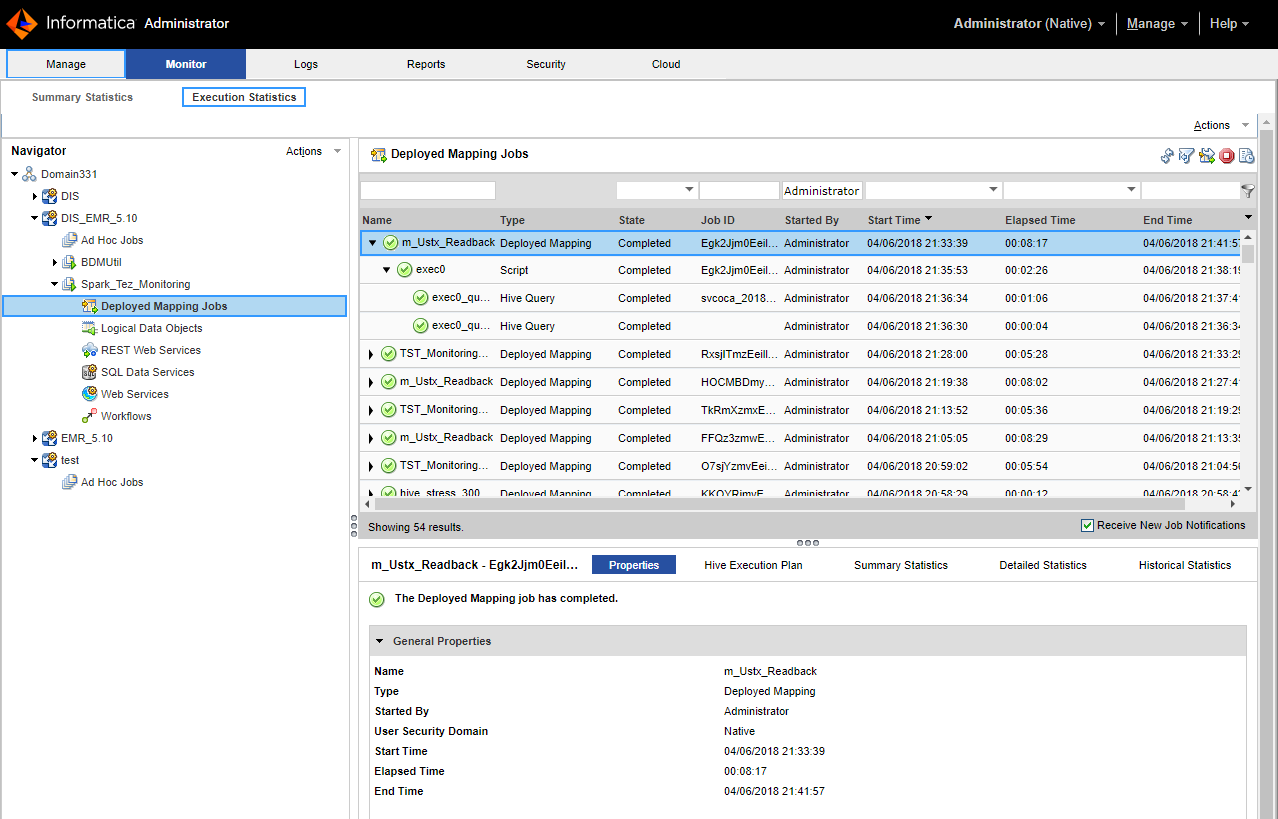
You can monitor a mapping that runs in the Hadoop environment.
  1. In the Administrator tool, click the
    Monitor
    tab.
  2. Select the
    Execution Statistics
    view.
  3. In the Navigator, choose to open an ad hoc job, a deployed mapping job, or a workflow.
    • To choose an ad hoc job, expand a Data Integration Service and click
      Ad Hoc Jobs
      .
    • To choose a deployed mapping job, expand an application and click
      Deployed Mapping Jobs
      .
    • To choose a workflow, expand an application and click
      Workflows
      .
    The list of jobs appears in the contents panel.
  4. Click a job to view its properties.
    The contents panel shows the default
    Properties
    view for the job. For a Blaze engine mapping, the Blaze engine monitoring URL appears in the general properties in the details panel. The monitoring URL is a link to the YARN web user interface for Spark jobs.
  5. Choose a view in the contents panel to view more information about the job:
    • To view the execution plan for the mapping, select the
      Execution Plan
      view.
    • To view the summary statistics for a job, click the
      Summary Statistics
      view.
    • To view the detailed statistics for a job, click the
      Detailed Statistics
      view.
    You can view the number of rows processed in the Summary Statistics for a Hive source or target. The remaining values do not appear for Hive sources and targets.
The following table describes the mapping job states in the Administrator tool contents panel:
Job Status
Rules and Guidelines
Queued
The job is in the queue.
Running
The Data Integration Service is running the job.
Completed
The job ran successfully.
Aborted
The job was flushed from the queue at restart or the node shut down unexpectedly while the job was running.
Failed
The job failed while running or the queue is full.
Canceled
The job was deleted from the queue or cancelled while running.
Unknown
The job status is unknown.

0 COMMENTS

We’d like to hear from you!