tab. Ad hoc jobs are jobs that users run from the Developer tool or the Analyst tool.
An ad hoc job is a preview, scorecard, profile, mapping, or reference table process that a user runs from the Developer tool or the Analyst tool. When a user runs a job, a Data Integration Service runs the job process and the job appears in the Monitor tab.
You can run up to five jobs at a time from the Developer tool. All remaining jobs are queued, and do not appear in the Monitor tab until they run.
By default, you can monitor jobs that you run. If you have the appropriate monitoring privilege, you can also view jobs that other users run.
When you select
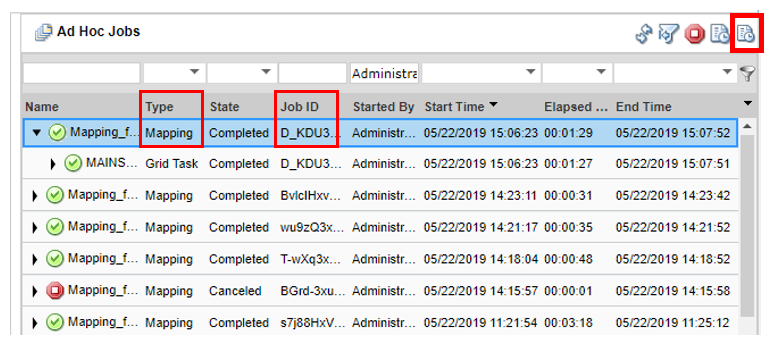
Ad Hoc Jobs
in the Navigator of the
Execution Statistics
view, a list of jobs appears in the contents panel. The contents panel groups related jobs based on the job type. You can expand a job type to view the related jobs under it. For example, when you run a profile job, the Data Integration Service converts the job into a mapping. The mapping appears under the profile job in the contents panel.
When you select a job in the contents panel, you can view logs for the job, view context for the job, or cancel the job. You can also view properties for the job in the details panel. Depending on the type of job, the details panel might show general properties, mapping properties, or statistics.
When you select Ad Hoc jobs in the Navigator of the Execution Statistics view, a list of jobs appears in the contents panel. The contents panel groups related jobs based on the job type. You can expand a job type to view the related jobs under it.
The following list describes the types of properties and statistics that can appear in the details panel:
Properties
Shows the general properties about the selected job, such as the name, job type, user who ran the job, and start time of the job.
If the job ran on a grid, the details panel shows the node that the job ran on.
Mapping Properties
You can view mapping properties when you select a profile or scorecard job in the contents panel.
These jobs have an associated mapping. You can view mapping properties such as the request ID, the mapping name, and the log file name. You can also view throughput and resource usage statistics for the associated mappings.
Blaze Execution Plan
You can view a Blaze execution plan when you run a mapping with the Blaze engine in the Hadoop environment. The Blaze execution plan displays the Blaze engine script that the Data Integration Service generates based on the mapping logic, the unique identifier for the script, and the tasks that the script depends on.
Summary Statistics
You can view summary statistics you select an ad hoc mapping job, deployed mapping job, or mapping object in a workflow in the contents panel. The
Summary Statistics
view displays throughput and resource usage statistics for the job run.
The following image shows the
Summary Statistics
view for a mapping job:
You can also view the summary statistics for the source or target on the
Summary Statistics
tab, such as processed rows and bytes.
Only the
number of rows processed
appears in the Summary Statistics for the Hive source and target. The remaining property values appears as 0 or N/A for the Hive source or target.
Detailed Statistics
You can view detailed statistics for an ad hoc mapping job, deployed mapping job, or mapping object in a workflow in the contents panel. Detailed statistics appear for jobs that run longer than one minute in separate local processes. The
Detailed Statistics
view displays graphs of the throughput and resource usage statistics for the job run.
The following image shows the
Detailed Statistics
view for a mapping job in a workflow:
Historical Statistics
You can view historical statistics when you select an ad hoc mapping job, deployed mapping job, or mapping object in a workflow in the
Contents
panel. The
Historical Statistics
view shows averaged data from the last 500 runs for a specific job. For example, you can view the minimum, maximum, and average duration of the mapping job. You can view the average amount of CPU that the job consumes when it runs. You can choose to view averages for mapping jobs with different states, such as completed, canceled, or aborted. A bar graph shows the number of jobs in each state. Click a link below the bar graph to view statistics for a specific state.
The following image shows the
Historical Statistics
view for a mapping job that completed three times and failed one time:
Aggregated Cluster Logs
You can get aggregated cluster logs for deployed mappings based on the job ID that run in the Hadoop environment. You can get a .zip or tar.gz file of the aggregated cluster logs for a mapping job and write the compressed aggregated log file to a target directory. You can also use the infacmd ms
fetchAggregatedClusterLogs
command to collect the aggregated cluster logs for a mapping job.