Table of Contents

Search

  1. Introduction to Data Discovery
  2. Data Discovery with Informatica Analyst
  3. Data Discovery with Informatica Developer
  4. Function Support Based on Profiling Warehouse Connection

Data Discovery Guide

Data Discovery Guide

Values in Detailed View

Values in Detailed View

The column values in detailed view include values for a column and the frequency in which the values appear in the column.
The
Values
pane displays the column values in a graphical representation. You can view the frequency, length, and percentage of each value. You can sort the values based on value or frequency. You can drill down on the data, add the values to a reference table, create a value frequency rule, or create a data domain. You can view the null values as a red vertical bar, the frequency of values as a black vertical bar, and the outlier values as vertical bars with orange highlight. You can highlight the outliers, disable outliers, or filter the results to display only outlier values in the column.
The Values pane contains the graphical layout and value sections.
The graphical layout is divided into two panels.
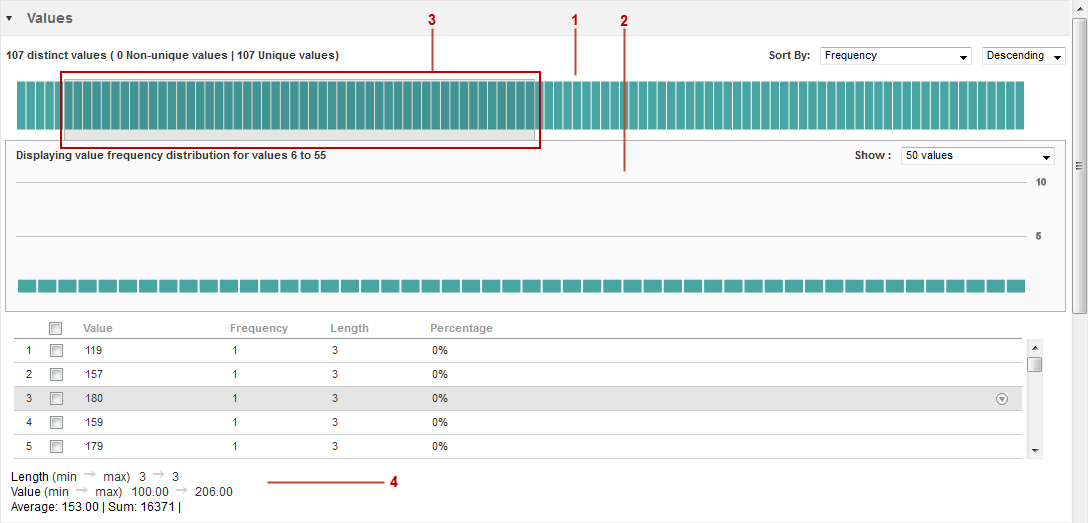
The following image shows the Values pane in the detailed view:
The image shows the values pane in the detailed view. You can view the upper pane and lower pane along with value properties.
  1. Upper panel. You can view the values as a vertical bar chart. You can sort the values by frequency and value. You can sort the value in ascending or descending order. You can view the outlier values as vertical bars with orange highlights.
  2. Lower panel. You can view the values in the slider in the lower panel where each value is represented by a vertical bar. You can drill down on the value, add the value to a reference table, create a value frequency rule, and create a data domain on the value. You can view 50, 75, or 100 values at a time.
  3. Slider. You can slide the slider over the values in the upper panel. The lower panel displays the values in the slider.
  4. Value properties. The value properties section displays the values and properties.
The following table describes the panels in the graphical layout:
Panel
Description
Upper panel
Displays all the values as a vertical bar chart. You can view a maximum of 16,000 values in the upper panel. You can use the slider to view a batch of values.
Lower panel
Displays the values for the batch that you select in the upper panel. By default, the Analyst tool displays 50 values. You can choose to view 75 or 100 values at a time.
The following table describes the properties for the column values in the value section:
Property
Description
Value
Displays a list of values for the batch that you select in the upper panel.
The Analyst tool excludes the CLOB, BLOB, Raw, and Binary data types in column values.
Frequency
Displays the number of times a value appears in the column, expressed as a number.
Length
Displays the length of the column value.
Percentage
Displays the percentage that a value appears in the column.
The following table describes the statistics for the selected column:
Statistics
Description
Length (min - max)
Displays the length of the shortest value and longest value for the column.
Value (min - max)
Displays the minimum and maximum values in the column.
Average
Displays the average of the values for the column.
Sum
Displays the sum of all the values in the column.

0 COMMENTS

We’d like to hear from you!