Data Profiling
- Data Profiling
- All Products

Property
| Description
|
|---|---|
Columns
Rules
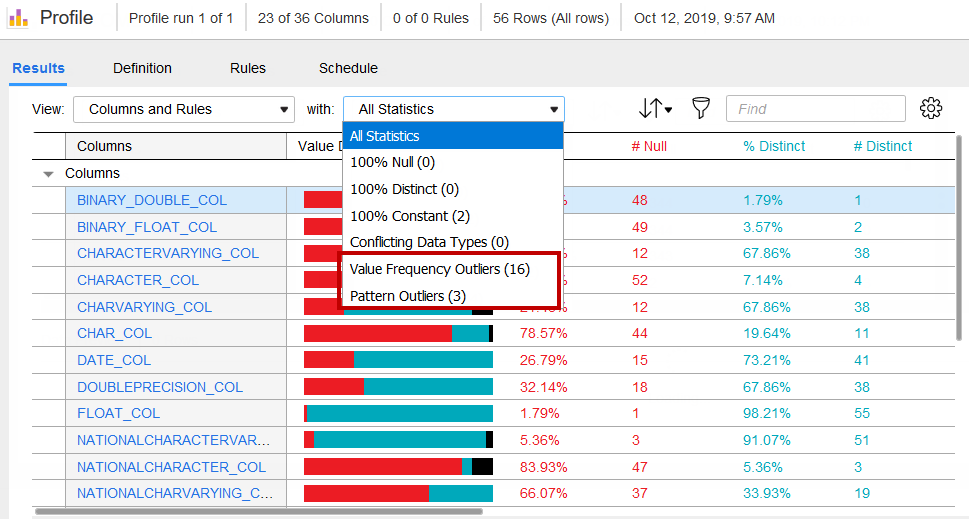
| Columns and rules in the profile run appear in collapsible sections. You can collapse or expand the section to view the columns and their statistics.
When you click a metric for a column, the metric is highlighted in the
Data Preview area. When you click a column name, the detailed view for the column appears.
|
Value Distribution
| Distribution of null values, distinct values, and non-distinct values in a horizontal bar chart for a column or rule.
|
% Null
| Percentage of rows with null values in the column or rule.
|
# Null
| Number of null values in the column or rule.
|
% Distinct
| Percentage of rows with distinct values in the column or rule.
|
# Distinct
| Number of distinct values in the column or rule.
|
% Non-distinct
| Percentage of rows with non-distinct values in the column or rule.
|
# Non-distinct
| Number of non-distinct values in the column or rule.
|
# Patterns
| Number of patterns in the column or rule.
|
% of Top Pattern
| Percentage of rows with the most frequent pattern in the column or rule.
|
Maximum Length
| Length of the longest value in the column.
|
Maximum Value
| Highest value in the column.
|
Minimum Length
| Length of the shortest value in the column.
|
Minimum Value
| Lowest value in the column.
|
% Blank
| Has no value in the column or rule.
|
# Blank
| Percentage of rows that have no value in the column or rule.
|
Character
| Description
|
|---|---|
'B' or 'b' or ' '
| Represents a blank space.
|
'C' or 'c'
| Represents any character.
|
'L' or 'l'
| Represents any lowercase alphabetic character.
|
‘T’ or ‘t’
| Represents a tab.
|
‘U’ or ‘u’
| Represents any uppercase alphabetic character.
|
9
| Represents any numeric character.
Data Profiling displays up to three characters separately in the "9" format. The tool displays more than three characters as a value within parentheses. For example, the format "9(8)" represents a numeric value with eight digits.
|
'X' or 'x'
| Represents any alphabetic character.
Data Profiling displays up to three characters separately in the "X" format. The tool displays more than three characters as a value within parentheses. For example, the format "X(6)" might represent the value "Boston."
The pattern character X is not case sensitive and might represent uppercase characters or lowercase characters from the source data.
|
'P' or 'p'
| Represents "(", the opening parenthesis.
|
'Q' or 'q'
| Represents ")", the closing parenthesis.
|

