Data Profiling
- Data Profiling
- All Products


Option
| Description
|
|---|---|
View
| Shows the following options:
|
With
| Shows the following options:
Choose a filter in the
With option after you choose a filter in the
View option.
|
Sort
| Choose a column statistic to sort the results in ascending or descending order.
|
Filter
| To filter the results, you can perform one or both of the following actions:
|
Find
| Enter a keyword to view the relevant search results.
|
Menu
| Choose Comfortable, Cozy, or Compact to adjust the row width in the profile results area.
|


Property
| Description
|
|---|---|
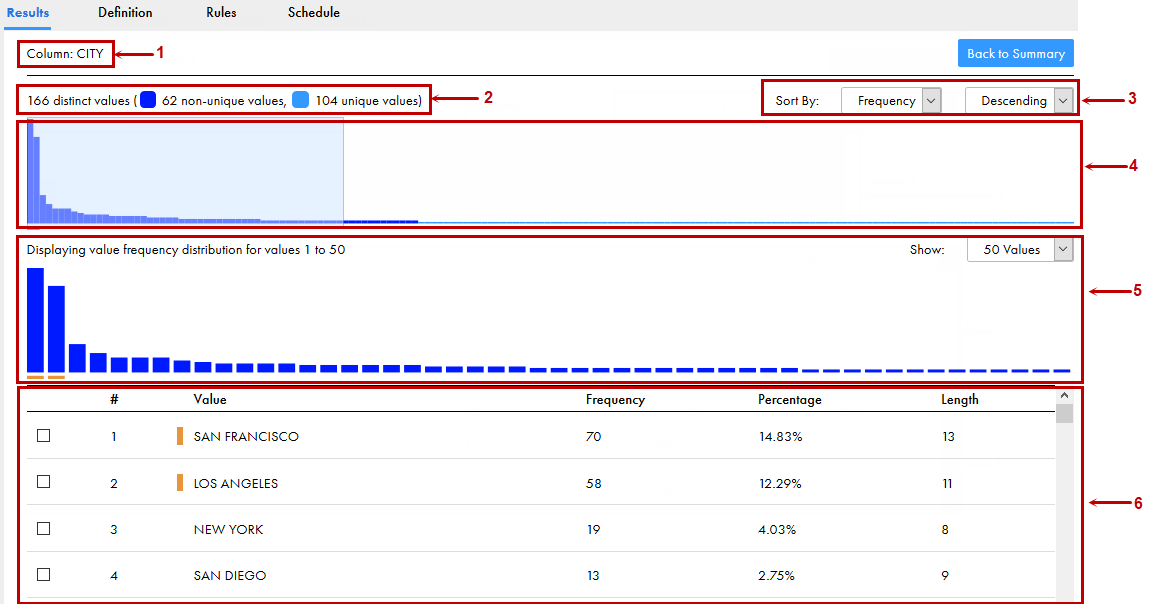
Column <column_name>
Rule <rule_output_name>
| Shows the column name or rule output name.
|
Back to Summary
| Click the button to go back to the summary view of profile results.
|
<total_number> distinct values (<number_of_non-unique_values>, <number_of_unique_values>
| Shows the total number of distinct values in the column or rule. This property also shows the number of non-unique and unique values, with the color legend, in the column or rule.
|
Sort By
| You can sort the value frequency distribution based on the date, integer, and decimal data types.
Choose
Frequency or
Value , and then choose
Ascending or
Descending to sort the value frequency distribution as required.
|
Bar chart
| Shows the values as a vertical bar chart. You can view a maximum of 16,000 values in the upper area. You can slide the slider over the values in the upper area. The lower area displays the values in the slider. The outlier values appear with an orange underline.
|
Detailed chart
| Shows the values in the slider in the upper area. By default, 50 values appear in the lower area. You can choose to view 75 or 100 values at a time. The outlier values appear with an orange underline.
|
Value distribution table
| Shows the following statistics in a tabular format:
The outlier values appear with a vertical bar.
|

Section
| Description
|
|---|---|
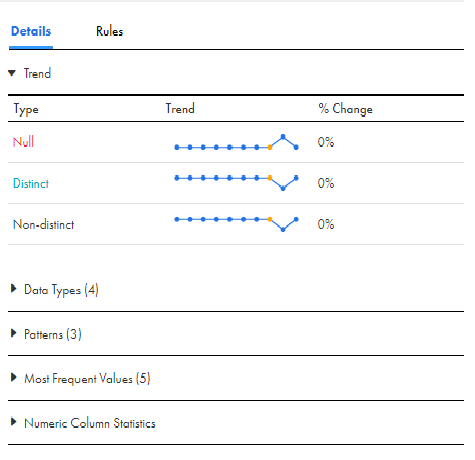
Trend
| Trend chart for percentage change in null, distinct, and non-distinct values. The trend chart shows the change for a maximum of 10 profile runs in a line chart.
The chart displays the trend based on the profile run you have selected.
For example, consider that there are 20 profile runs, and you are viewing the tenth profile run. In this case, the trend appears for five profile runs before the tenth profile run and four runs after the tenth profile run.
|
Data Types <number_of_inferred_data_type>
| Shows the documented data type for the column in the data source. The section also shows the inferred data type, frequency percentage in which it appears in the column or rule, and a horizontal bar chart which is a virtual representation of data type distribution. Hover over the bar chart to view the number of rows that has the inferred data type.
Select a data type to drill down and view the drilldown results in the
Data Preview area.
|
Patterns <number_of_inferred_patterns>
| Shows the inferred pattern, frequency percentage in which it appears in the column or rule, and a horizontal bar chart which is a virtual representation of pattern distribution. Hover over the bar chart to view the number of rows that has the inferred data type.
Select a pattern to drill down and view the drilldown results in the
Data Preview area.
|
Most Frequent Values
| Shows the top five values that appear frequently in the column.
|
Numeric Column Statistics
| Shows the following statistics for columns with numeric documented data type:
|
Rules
| Shows the associated rules for the column and the rule details.
|