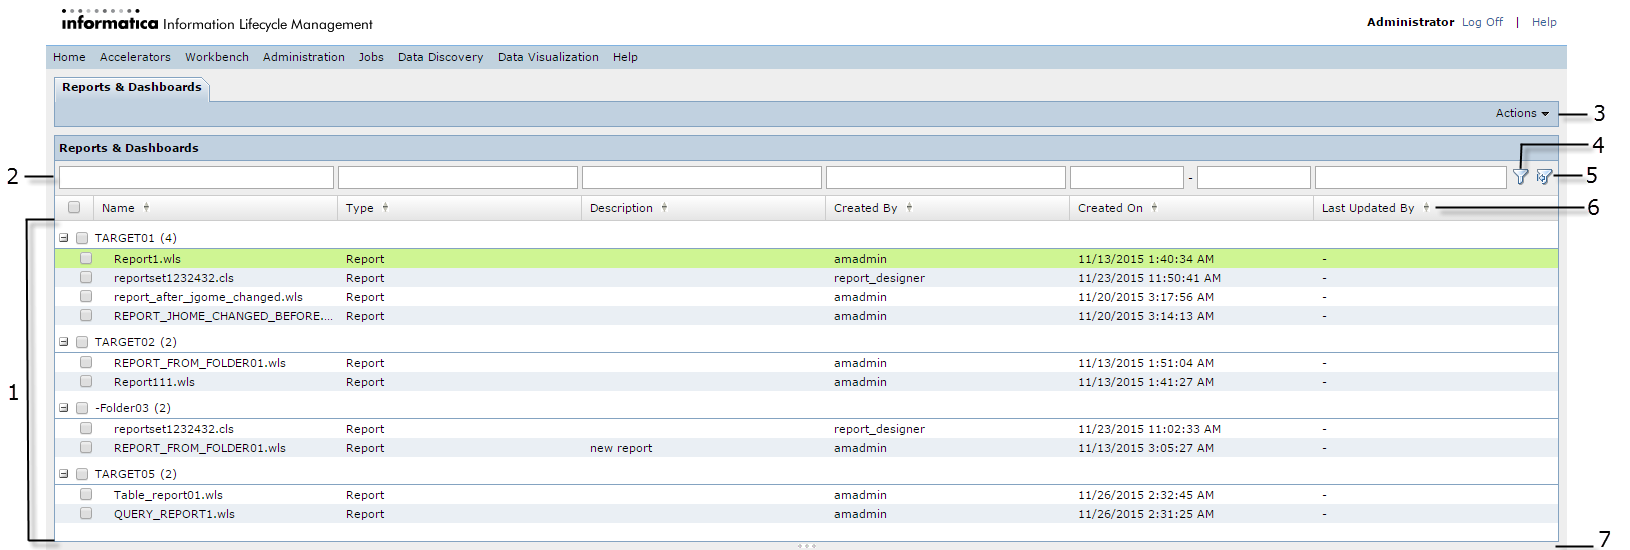
window displays a list of reports with sort and filter options.
The following figures show the
Reports and Dashboards
window:
List of available reports. Click a row to select the report you plan to run. Click one or more checkboxes to select reports you want to delete.
Filter box. Enter the entire or part of the value in the filter box above the appropriate column heading and click the filter icon.
Actions drop-down menu. Contains options to run, create, edit, and copy reports. Also contains the options to add permissions or revoke permissions for selected reports.
Filter icon. After you specify filter criteria in the fields above the column names, click the filter icon to display the reports.
Clear filter icon. Click this icon to clear any filter settings.
Sort icon. Click this icon to sort columns alphabetically or chronologically.
Resizing bar. Click and drag the bar up and down to resize the sections.
Properties section. Displays report details.
Permissions icon. Click the Permissions icon to switch to the permissions section from the properties section.
Permissions section. The permissions section displays which users and access roles have permission to take an action on a report. This information is only visible to you if you have the "grant" permission on your login user or access role for the selected report. If you do not have the grant permission, you will only see the permissions information for your own user and access role.
You can also launch the Data Visualization Advanced Reporting interface from the
Data Visualization
menu. You can use the Advanced Reporting interface to run reports. To access the Advanced Reporting interface, you must run the chosen report with a user that has the Report Admin role.
You can see the
Data Visualization
menu option if your product license includes data visualization.