tab, you can review the run-time topology and the performance of deployed objects. From a topology perspective, you can review high availability configurations, the assignment of application services to various hosts, and the objects that are deployed on any given application service. You can also obtain real-time information about CPU and memory usage statistics from various hosts. From an object perspective, you can view the state of a deployed object, start and stop objects, and trace the flow of events for rules, along with event values, over a specified timeline.
The
Dashboard
tab consists of the
Metrics
,
Events
, and
Logs
view.
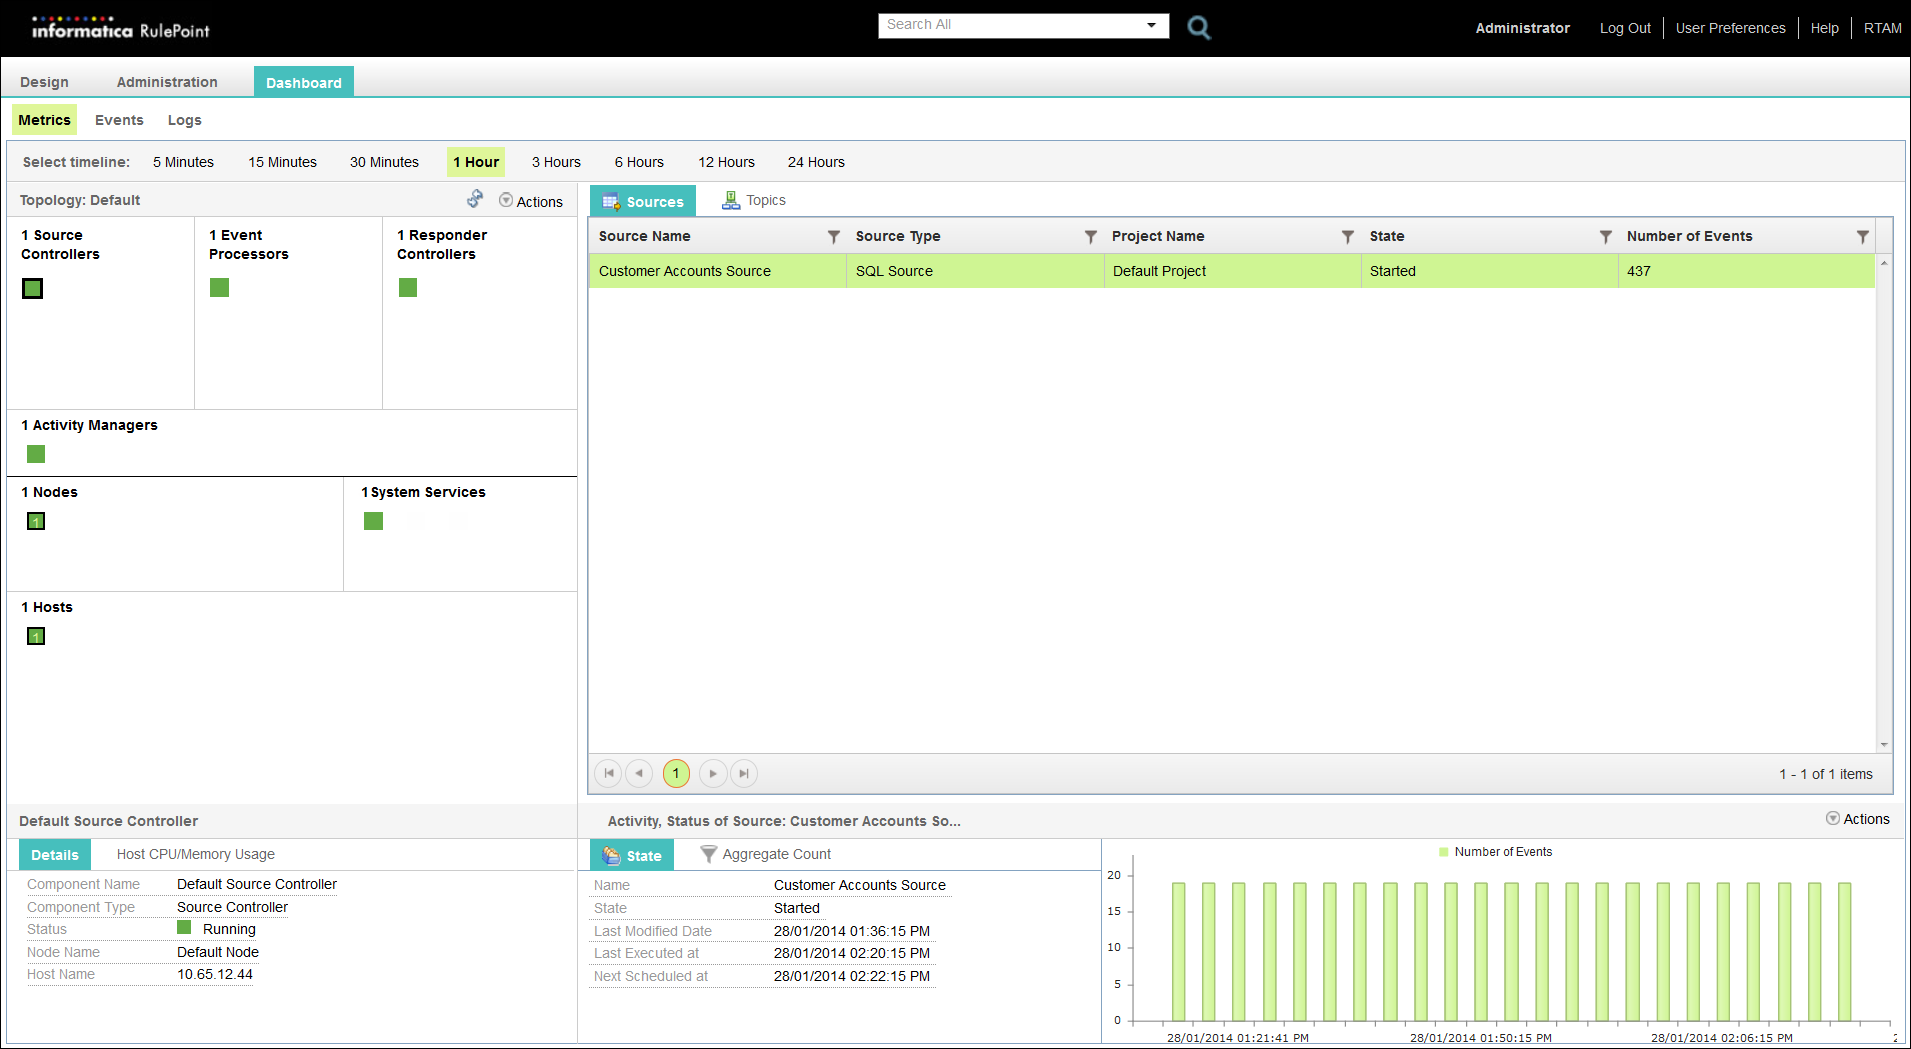
The following image shows the
Metrics
view on the
Dashboard
tab for a single node topology:
In the top-left pane of the
Metrics
view, the dashboard displays the configured application services, system services, activity manager, nodes, and hosts in the topology. When you select an application service, the dashboard highlights the host and node in which the application service is configured. The contents pane displays the objects that are deployed on the selected host.
The dashboard also consists of timeline-based views that show run-time statistics for a specific period of time in the immediate past. You specify the time period for which you want to view information by selecting a view. Each timeline-based view shows you the following information:
CPU and memory usage on the selected host, in the form of a graph.
Name, type, state, and activation count for all deployed objects.
Average throughput, maximum latency, and average latency of the deployed sources and responders.
Number of events in topics, number of evaluations and number of activations for rules, and number of alerts for responses.
Functions that you can administer, for example, stop events from publishing, resume processing, enable rule tracing, purge events, and troubleshoot events.
You can use the
Events
view to view all the generated events or search for specific events. The
Logs
view displays the run-time logs and you can check for errors.