Table of Contents

Search

  1. Preface
  2. Introduction
  3. Configuring the Data Director Application
  4. Establishing a Root Node
  5. Defining the Business Entity Model
  6. Configuring Business Entity Properties
  7. Configuring Reference Entity Properties
  8. Transforming Business Entities and Views
  9. Configuring Hierarchy and Network Relationships
  10. Creating Match Rule Sets
  11. Configuring Search
  12. Configuring Tasks
  13. Configuring Security and Data Filters for Business Entities
  14. Configuring the Content Security Policy
  15. Integrating Data as a Service
  16. Configuring External Calls
  17. Designing the Data Director User Interface
  18. Localizing Data Director
  19. Appendix A: Provisioning Tool Frequently Asked Questions

Source Data

Source Data

You choose the source data that you want to use in the chart. The source data comes from reports that collect information about your master data. You can also filter or group the source data used in charts.
Before you can generate reports or populate charts, you must configure the data mart database connection. Then you can populate the data mart with the report data. For more information, see the
Multidomain MDM Resource Kit Guide
.

Reports

You can use the out of the box reports to collect information about your records and tasks. The out of the box reports are available by default and collect information about predefined criteria. If you need to collect other types of information about your master data, you can create custom reports.
For example, you might use a report to collect information about the number of tasks assigned to each user. Or, you might use a report to collect information about the number of records added for each business entity type.
You must register the out of the box reports and custom reports that you want to use. For more information, see the
Multidomain MDM Business Entity Services Guide
.
The following table describes the out of the box reports:
Report ID
Report
Description
MDM.RPT.1
Tasks Overview by Status
Displays the total number of tasks and breaks down the tasks by status. You can drill down to users assigned for each task status.
MDM.RPT.2
Task Overview by Priority
Displays the total number of tasks and breaks down the tasks by priority. You can drill down to users assigned for each task priority.
MDM.RPT.4
Business Entities Added by Year
Displays the number of records added for each business entity type and breaks down the records by year.
MDM.RPT.5
Customer Onboarding Time
Displays how long it took to qualify records.
MDM.RPT.6
Business Entities by Source Systems
Displays the total number of records for each business entity type that comes from each source system. The detailed report breaks down the records for each pair of business entity type and source system by year.
MDM.RPT.7
Assigned Tasks by Users
Displays the total number of tasks assigned to each user.
MDM.RPT.8
Open Tasks by User Roles
Displays the total number of tasks that are open by user roles.
MDM.RPT.10
Closed Tasks by Users
Displays the total number of tasks that are closed by each user.

Filters

To narrow the focus of a chart, you can filter the source data used in the chart. You can filter the source data by data dimensions collected in the report.
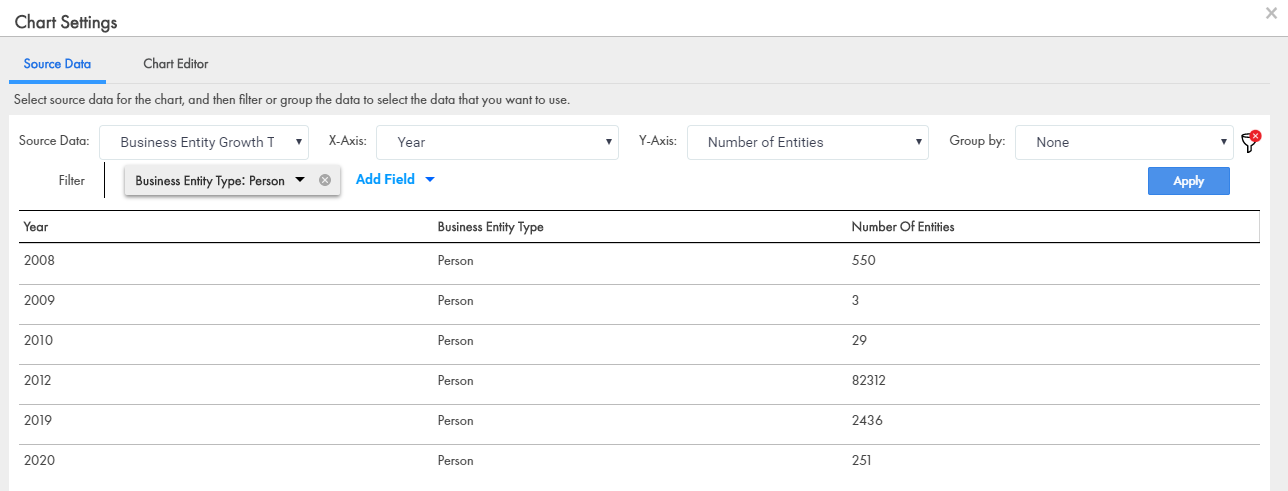
For example, you might populate the chart with data collected by the out of the box Business Entities Added report. The report collects information about the number of records added for each business entity type and breaks down the records by year. The chart shows business entity growth trends for all business entity types. You can filter the source data to only include records created for the Person business entity type. Then the chart shows business entity growth trends for the Person business entity type.
You can also use filters to ensure that new data is included in the chart. For example, you might populate the chart with data collected by the Business Entities Added report and filter the data to only included records created for the Person business entity type. Then when users create new records for the Person business entity type, the chart displays the new data in the chart.
The following image shows a chart that displays the number of records created for the Person business entity type and breakdowns the records by year:
The Source Data tab displays filtered source data.

Group by

To segment data in a data series into groups, you can group the source data displayed in a chart by a criteria in the underlying data. The grouped data appears side by side or stacked. You might want to use the group by criteria for bar graphs.
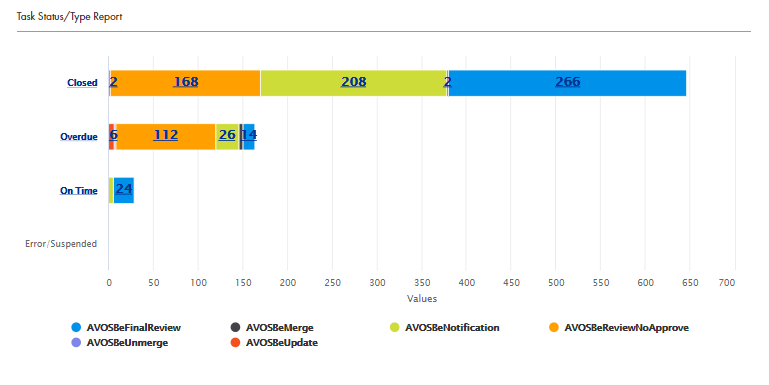
For example, you might create a chart that shows tasks by status and then grouped by task type. The chart displays the tasks by status, with the data about each status grouped by task type.
The following image shows a chart with grouped data:
An example of a Chart component displaying segmented data grouped by task status.

0 COMMENTS

We’d like to hear from you!