Table of Contents

Search

  1. Preface
  2. Welcome to Informatica Process Developer
  3. Using Guide Developer for the First Time
  4. Getting Started with Informatica Process Developer
  5. About Interfaces Service References and Local WSDL
  6. Planning Your BPEL Process
  7. Participants
  8. Implementing a BPMN Task or Event in BPEL
  9. Implementing a BPMN Gateway or Control Flow
  10. Using Variables
  11. Attachments
  12. Using Links
  13. Data Manipulation
  14. Compensation
  15. Correlation
  16. What is Correlation
  17. What is a Correlation Set
  18. Creating Message Properties and Property Aliases
  19. Adding a Correlation Set
  20. Deleting a Correlation Set
  21. Adding Correlations to an Activity
  22. Rules for Declaring and Using Correlation Sets
  23. Correlation Sets and Engine-Managed Correlation
  24. Event Handling
  25. Fault Handling
  26. Simulating and Debugging
  27. Deploying Your Processes
  28. BPEL Unit Testing
  29. Creating POJO and XQuery Custom Functions
  30. Custom Service Interactions
  31. Process Exception Management
  32. Creating Reports for Process Server and Central
  33. Business Event Processing
  34. Process Central Forms and Configuration
  35. Building a Process with a System Service
  36. Human Tasks
  37. BPEL Faults and Reports

Designer

Designer

User Reports Sample

User Reports Sample

This sample has reporting samples and information that will help you design and deploy your own reports. The first step is to create the report using the reporting module in Process Developer is built on the robust BIRT reporting engine. That engine has eclipse plug-in support, which Process Developer includes for you. These plugins contain a rich editing environment for the construction of new reports. Once you have created a report, you can then use a Business Process Archive (BPR file) to deploy it to the server as a resource.
After deployment, the report is available on the Report page of the console and optionally on the Reports tab of Process Central if you specify this using a Process Central configuration (
.avcconfig
) file. This sample's documentation supplies information about using reports with Process Developer, but only helps supplement the reporting module's (BIRT) documentation. Please refer to the BIRT documentation for more details on advanced reporting features.
This topic discusses the following:
  • Getting Started
  • Sample Reports
  • Deploying Reports
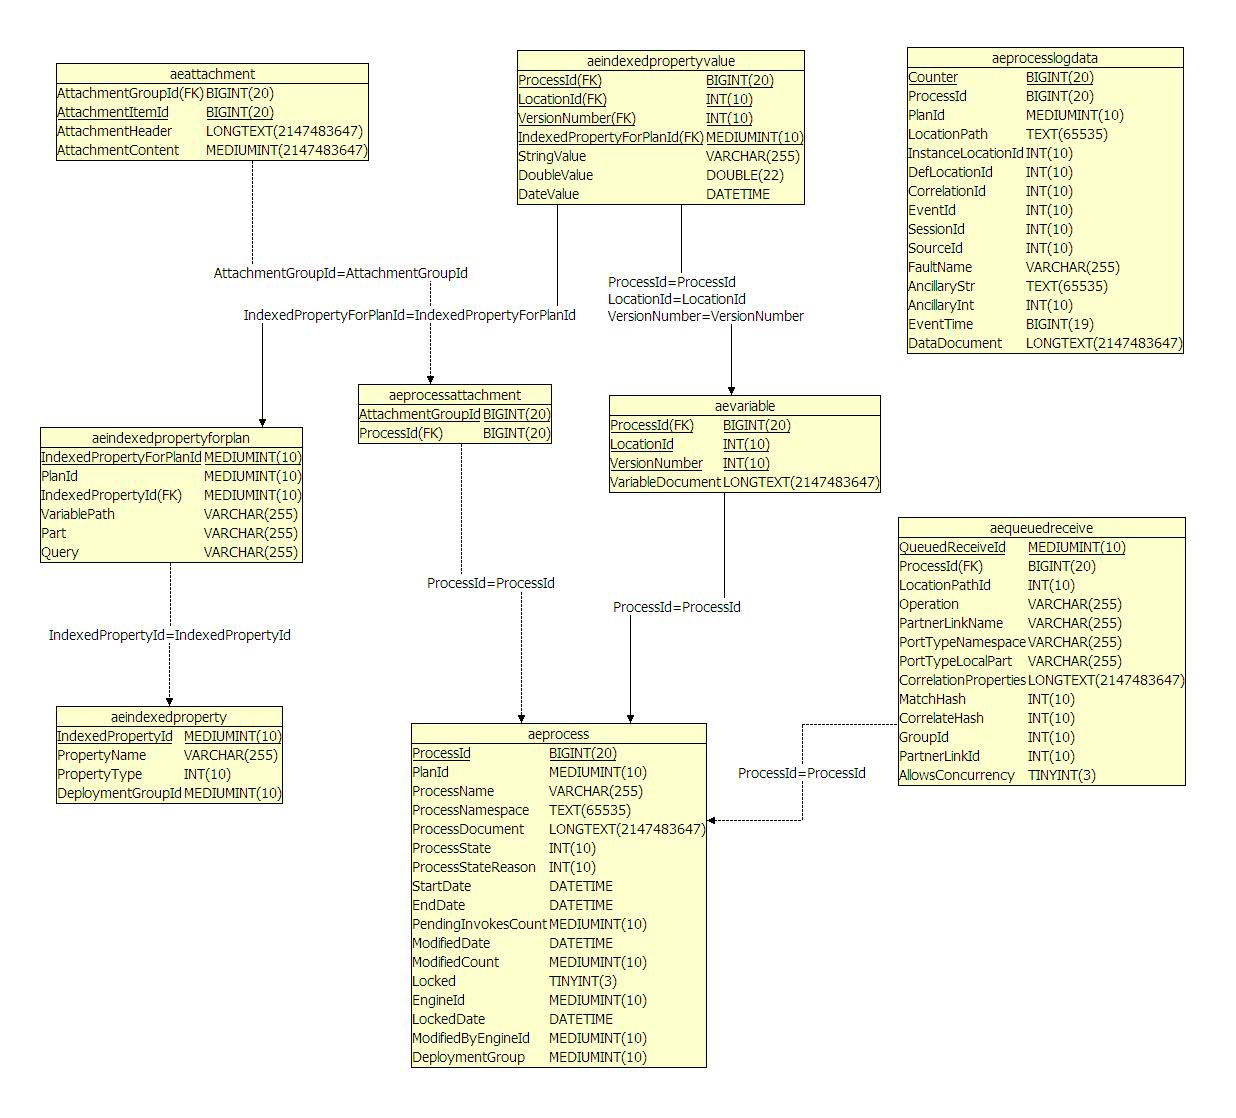
  • Process Data Model
  • Process Data Model Entity Relation Diagram Subset
  • Human Task Data Model

Getting Started

You can add a new report to any project. It is good practice to separate the reporting files from other files in your project. In this example, the supplied reports are stored in the
report
folder. When you use
File > New
and choose to create a new report, always use the Process Developer Template. The template has a script, which when the report is deployed, automatically detects the Data Source connection information by using the supplied
AeBirtContext
class.
If you are interested in this script, open a report that uses the template, select the Data Source, and then click on the
Script
tab in the report editor. The Data Source while in Process Developer does not use the server settings; instead, it is predefined to point to your embedded Process Server's server derby database. This database has a limitation that only one application can connect to it at a time, so if you are creating reports using derby make sure you stop the embedded Process Server first.
Note
: If you need to change the default, edit the data source properties to point to the database in which you store your data.
Once you have created a new report, the next step is to define a data set. A data set is the SQL and parameters that return the results from the database. After creating the SELECT statement, you can simply drag the data set onto the canvas and a simple table is created for you. Now you can go ahead and make any of the formatting changes for your report that you need.
Charts and other reporting types are also available. To use these features, you will need to consult the BIRT documentation. A few chart samples are included to give you a sense of the capabilities. Please note that these reports were designed and tested against the embedded server's derby database. You may need to make modifications to the SQL Data Set for each report if you want to use them with another supported database.

Sample Reports

Report
Description
IndexedPropertyValues
Displays all the indexed values in the system grouped by property name. Additionally it can show an individual property's values using the filter.
ProcessDistribution
Displays a pie chart of the distribution of process executions by process deployment (plan I, process name). Additionally, it has a listing of the counts.
OpenTaskRoles
Displays the users and groups and their roles for open tasks.
ProcessResponseTimes
Displays a chart showing process response times.
ProcessStatesByDate
Displays a chart showing process states by date.
ProcessStatesByProcess
Displays a chart showing process states by process name.
ProcessList
Displays a list of running processes similar to the Console's Active Process List. Clicking on a Process ID link opens the process view in a new tab.
Note
: This sample also shows how to create links to the console process detail view page.

Deploying Reports

Reports are easily deployed simply by selecting them or the folder where they reside using the context menu to select
Export
. From within the displayed dialog, select the
Orchestration > Business Process Archive
export option. Select a location for your BPR file. Typically, you will also choose Web service deployment with the location of your server (the default is localhost on port 8080). Also, make sure to check the
Replace existing resources
checkbox or the system may not overwrite the previous report deployments unless you have set that as the default when setting server properties.
You can also choose to save the deployment script, which is an ant script that can deploy your reports again simply by selecting
Execute
from the context menu. Note the sample project has a saved deployment script in the deploy folder that you can use to automatically deploy the sample reports. Selecting the
Next
button brings you to a page where you will see your reports in the additional resources list. Choose a
Process Group
name for both your entries, for example
Sample Reports
.

Process Data Model

Table 1 - Process Developer Process Tables
Table
Description
Notes
AeUserProcessView
(
AeProcess
)
Holds the main state of a process instance. The primary state of the process (for example,
running
,
started
,
completed
, and so on) is stored in the
ProcessState
column.
Actual BPEL language information and related services are stored in a related table, called
AePlan
.
AeVariable
This is the set of variable data associated with the process.
AeIndexedPropertyValue
During deployment, you can choose to index fields from variables in your process. This table stores those values, which are typically your key performance indicators (KPI).
In order to find the property name associated with the value data, you need to link to
AeIndexedPropertyForPlan
(plan is the deployment information/table for a process definition) and the
AeIndexedProperty
tables.
AeProcessLogData
Contains the logging information associated with a process instance.
This is used to do root cause analysis (show process state at a point in time) of issues. It also contains useful reporting information.
AeProcessAttachment
Contains any attachments to variables in the process.
The actual attachment data is stored in the
AeAttachment
table as a BLOB.
AeAttachment
Stores the BLOB of an attachment.
Others ...

Process Data Model Entity Relation Diagram Subset

Figure 1--ER Diagram for some of the process centric tables.

Human Task Data Model

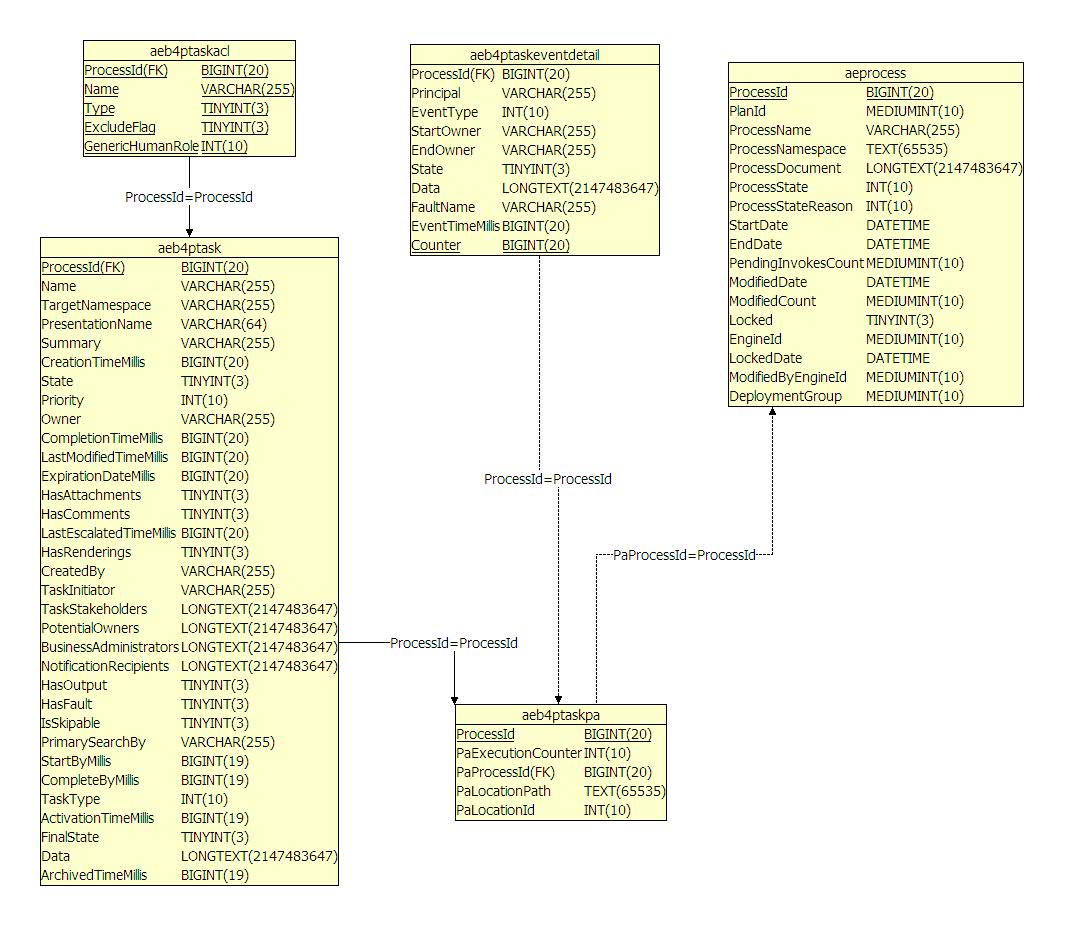
In order to create human task-centric reports, you will need a basic understanding of the human task data model. The data model is of course centered on the task, which is in the
AeB4PTask
table. The primary key of this table is the
ProcessId
. Other tables have keys that relate back to the
ProcessId
in this table. As mentioned in the process section of the data model, a system process actually handles the task state management using the
AeB4PTask
table and the
AeProcess
table.
Table 2 contains a short list and descriptions of task tables for which you may have monitoring or other interests. Figure 2 contains a portion of the full data model that is centered on the
AeB4PTask
table.
Table 2 - Human Task Tables
Table
Description
Notes
AeB4PTask
Holds the main state of a task instance. The primary state of the task (for example,
unclaimed
,
claimed
,
started
,
completed
, and so on) is stored in the State column see Table 4 below The
TaskType
column indicates whether the row contains a task or notification, (0=task, 1=notification).
Much of the task state interaction is accomplished through processes. Tochange anything in a task, you must use the WS-HT Service API. Most task access information is stored in
CLOB
columns in this table as organization entities. However, for quicker access when logging in, it is is also separated into its own table (
AeB4pTaskACL
).
AeB4pTaskACL
This table contains the access control list for the task. Type is zero for user and 1 for group. See Table 3 below for generic human role column values.
This table controls access to task information when using the WS-HT API. It controls what is visible to a user who is logged into the Process Central inbox, or another client application.
AeB4PTaskPa
AeB4PTaskEventDetail
Contains all events that change the state of the task.
This is used to produce the history of a task.
AeB4PTaskAttachments
Contains the attachments associated with a task.
This is used to store attachments that are associated with a task and are typically available in the task detail display.
Others ...
Table 3--AeB4PTaskACL: GenericHumanRole Column
Role
Value
Description
Initiator
0
Task Initiator
Stakeholder
1
Task Stakeholder
Potential Owner
2
Potential Owner
Actual Owner
3
Actual Owner
Excluded Owner
4
An excluded owner
Business Administrator
5
Business Administrator
Notification recipient
6
Recipient of a notification task type
Table 4--AeB4PTask: State Column
State
Value
Deferred
0
Unclaimed
1
Claimed
2
Started
3
Completed
4
Skipped
5
System Error
6
Faulted
7
Exited
8
Suspended
9
Figure 2--Human Task ER Diagram Subset
Figure 1 - ER Diagram for some of the process centric tables.

0 COMMENTS

We’d like to hear from you!